
 "Presidential Election 2017 today: A primer on polls which will decide Pranab Mukherjee's successor")
By Vibhor Relhan
The current President will complete his five-year term in July 2017. The Election Commission has announced that elections for the next President will be conducted on 17 July. These elections will be on the basis of single transferable voting (STV) that results in (approximately) proportional representation. The President is elected by the representatives of the people through an Electoral College.
This Electoral College consists of:
- the elected members of both Houses of Parliament (543 in Lok Sabha and 233 in Rajya Sabha) and - the 4120 elected members of all the 31 Legislative Assemblies of the States (MLAs) including NCT of Delhi and the Union Territory of Puducherry.
In the college each MP and MLA is allocated a value to determine the vote value of an MLA, it is calculated on the basis of the population of the state to which the MLA belongs in 1971. Hence, the value of the vote of a MLA remains the same within his/her state but varies across different states. For instance, the value of an Uttar Pradesh MLA is 208 while that of a Sikkim MLA is 7. The sum total of the value of all MLAs’ votes is equal to the value allocated to votes of all the MPs combined. All the MPs are allocated the same value for their vote.
Value of vote of a MLA is calculated as: Total population of the MLA’s state in 1971 / (No. of elected MLAs in the state x 1000) Value of vote of a MP is calculated as: Total value of votes of 4120 MLAs/776 (Total Number of MPs)
Every voter has one vote. Every voter can mark as many preferences, as there are candidates contesting the election. It is necessary for at least the first preference to be marked for the vote to be considered valid. A candidate needs to win the required number of votes (quota) to be elected. If no one achieves the required quota after the first round of counting the value of first preference votes, the candidate with the lowest value of votes is eliminated.
His/her votes are then transferred to the respective second preference mentioned (if any) on the votes he received. If no one still achieves the required quota, then the process will repeat till either:
- a candidate achieves the required quota or - all candidates, except one, are eliminated.
Presidential Elections (July, 2017)
Let us assume that: - no state assembly or Lok Sabha will be dissolved till July, - no defections occur, - all alliances remain same for electing Presidential candidate, and - all MLAs and MPs vote along party lines (though whips cannot be issued for Presidential elections).
The electoral college consists of all the elected 776 MPs and 4120 MLAs. Table 1 depicts the statement of value of vote of each state’s MLA and every MP for the elections.
Table 1: Statement of value of votes of elected members of the state legislative assemblies and Parliament 2017
| Name of State | No of Assembly seats (elective) | Population (1971 Census) | Value of vote of each MLA | Total value of votes for the state | Percentage of Total Value of Votes | |
|---|---|---|---|---|---|---|
| Total | 4120 | 549302005 | 549495 | 50.00% | ||
| 1 | Andhra Pradesh | 175 | 27800586 | 159 | 159 × 175 = 27825 | 2.53% |
| 2 | Arunachal Pradesh | 60 | 467511 | 8 | 008 ×060 = 480 | 0.04% |
| 3 | Assam | 126 | 14625152 | 116 | 116 ×126 = 14616 | 1.33% |
| 4 | Bihar | 243 | 42126236 | 173 | 173 ×243 = 42039 | 3.83% |
| 5 | Chhattisgarh | 90 | 11637494 | 129 | 129 ×090 = 11610 | 1.06% |
| 6 | Goa | 40 | 795120 | 20 | 020 ×040 = 800 | 0.07% |
| 7 | Gujarat | 182 | 26697475 | 147 | 147 ×182 = 26754 | 2.43% |
| 8 | Haryana | 90 | 10036808 | 112 | 112 ×090 = 10080 | 0.92% |
| 9 | Himachal Pradesh | 68 | 3460434 | 51 | 051 ×068 = 3468 | 0.32% |
| 10 | Jammu & Kashmir* | 87 | 6300000 | 72 | 072 ×087 = 6264 | 0.57% |
| 11 | Jharkhand | 81 | 14227133 | 176 | 176 ×081 = 14256 | 1.30% |
| 12 | Karnataka | 224 | 29299014 | 131 | 131 ×224 = 29344 | 2.67% |
| 13 | Kerala | 140 | 21347375 | 152 | 152 ×140 = 21280 | 1.94% |
| 14 | Madhya Pradesh | 230 | 30016625 | 131 | 131 ×230 = 30130 | 2.74% |
| 15 | Maharashtra | 288 | 50412235 | 175 | 175 ×288 = 50400 | 4.59% |
| 16 | Manipur | 60 | 1072753 | 18 | 018 ×060 = 1080 | 0.10% |
| 17 | Meghalaya | 60 | 1011699 | 17 | 017 ×060 = 1020 | 0.09% |
| 18 | Mizoram | 40 | 332390 | 8 | 008 ×040 = 320 | 0.03% |
| 19 | Nagaland | 60 | 516449 | 9 | 009 ×060 = 540 | 0.05% |
| 20 | Odisha | 147 | 21944615 | 149 | 149 ×147 = 21903 | 1.99% |
| 21 | Punjab | 117 | 13551060 | 116 | 116 ×117 = 13572 | 1.24% |
| 22 | Rajasthan | 200 | 25765806 | 129 | 129 ×200 = 25800 | 2.35% |
| 23 | Sikkim | 32 | 209843 | 7 | 007 ×032 = 224 | 0.02% |
| 24 | Tamil Nadu | 234 | 41199168 | 176 | 176 ×234 = 41184 | 3.75% |
| 25 | Telangana | 119 | 15702122 | 132 | 132 ×119 = 15708 | 1.43% |
| 26 | Tripura | 60 | 1556342 | 26 | 026 ×060 = 1560 | 0.14% |
| 27 | Uttarakhand | 70 | 4491239 | 64 | 064 ×070 = 4480 | 0.41% |
| 28 | Uttar Pradesh | 403 | 83849905 | 208 | 208 ×403 = 83824 | 7.63% |
| 29 | West Bengal | 294 | 44312011 | 151 | 151 ×294 = 44394 | 4.04% |
| 30 | Nct Of Delhi | 70 | 4065698 | 58 | 058 ×070 = 4060 | 0.37% |
| 31 | Puducherry | 30 | 471707 | 16 | 016 ×030 = 480 | 0.04% |
Source: ECI, PRS
A) Value of each vote of members of parliament: total members Lok Sabha (543) + Rajya Sabha (233) = 776 Value of each vote = 549474/776 = 708
B) Total Value of Votes of 776 Members of Parliament = 708 X 776 = 5,49,408 C) Total Electors for The Presidential Election = MLAS (4120) + MPs (776) = 4,896 D) Total Value of 4896 Electors for The Presidential Election 2017 = 549474 + 549408 = 10,98,903
Determining the Quota:
The total value of votes of the electoral college is divided by two and one is added to the quotient to determine the required quota for victory. Hence, the quota is calculated as:
Quota = (549408+549495)/2 + 1 = 1098903/2 + 1 = 549451+1 = 549452
Based on the knowledge of seats held by each party in the respective states and Parliament, and the value of votes of each MP and MLA from Table 1, we have calculated the total value of votes of each party in Table 2:
Table 2**: Party-wise strength in terms of total value of votes**
| Party | Total Seats | Total Value of Votes | Percentage of Total Value of Votes | |
|---|---|---|---|---|
| Total | 4896 | 1098903 | 100% | |
| 1 | Bharatiya Janata Party | 1728 | 433536 | 39.5% |
| 2 | Indian National Congress | 902 | 162829 | 14.8% |
| 3 | All India Trinamool Congress | 258 | 64447 | 5.9% |
| 4 | All India Anna Dravida Munnetra Kazhagam | 189 | 59224 | 5.4% |
| 5 | Biju Janata Dal | 145 | 37257 | 3.4% |
| 6 | Telugu Desam | 127 | 32190 | 2.9% |
| 7 | Communist Party Of India (Marxist) | 154 | 26474 | 2.4% |
| 8 | Samajwadi Party | 72 | 26366 | 2.4% |
| 9 | Shiv Sena | 84 | 25893 | 2.4% |
| 10 | Janta Dal (United) | 96 | 20736 | 1.9% |
| 11 | Telangana Rashtra Samithi | 85 | 20935 | 1.9% |
| 12 | Rashtriya Janata Dal | 87 | 18796 | 1.7% |
| 13 | Dravida Munnetra Kazhagam | 95 | 18528 | 1.7% |
| 14 | Yuvajana Sramika Rythu Congress Party | 76 | 17574 | 1.6% |
| 15 | Nationalist Congress Party | 60 | 15624 | 1.4% |
| 16 | Independent | 99 | 14950 | 1.4% |
| 17 | Bahujan Samaj Party | 34 | 9399 | 0.9% |
| 18 | Aam Aadmi Party | 89 | 8922 | 0.8% |
| 19 | Janta Dal (Secular) | 46 | 7820 | 0.7% |
| 20 | Shiromani Akali Dal | 23 | 6808 | 0.6% |
| 21 | Others | 433 | 66979 | 6.1% |
| 22 | Vacant | 14 | 3616 | 0.3% |
Source: ECI, PRS;
Note: Others include all parties with less than 5,500 votes or 0.5% of the total vote share. Party strengths calculated according to the seat tally at the time of the latest assembly election in any given state. By-elections have been taken into account. Mergers of parties has been taken into account. Defections have been accounted for only in Karnataka (KJP to BJP), Sikkim (SKM to SDF) and Arunachal (INC to PPA to BJP) since they were significant in number. Not accounting for other minor defections does not affect the outcomes significantly.
A candidate who gets 549,452 votes will win the election. If no candidate gets to this mark, the second and further preferences may be counted until the mark is reached or everyone else is eliminated. While the BJP falls short of the quota by 1,15,896 votes, the shortfall would be 23, 278 votes if all NDA allies support its candidate. The position of the NDA (5,26,174) and UPA (2,10,674) is depicted in the following figure at the two ends of the chart. All other major parties and independents are marked in the Middle.
The author is a program associate at PRS Legislative Research. He manages engagement with state legislators at PRS.


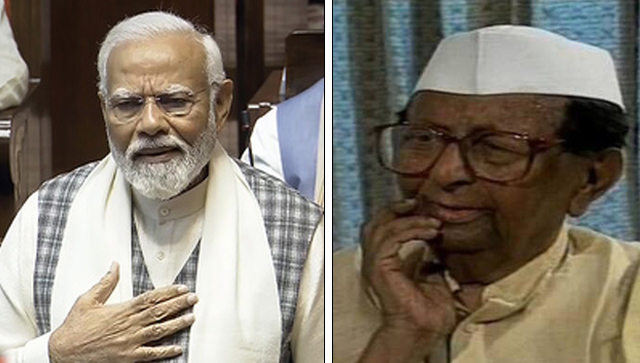 "Modi’s Rajya Sabha speech rekindles Sitaram Kesri’s humiliating ouster from Congress")
 "GhoseSpot | Rediscovering Pranab Mukherjee's pivotal role in Indian democracy through daughter Sharmistha's lens")
 "Pranab Mukherjee: Trusted by Indira Gandhi, doubted by Rajiv & Sonia, and outraged by Rahul’s sense of entitlement")
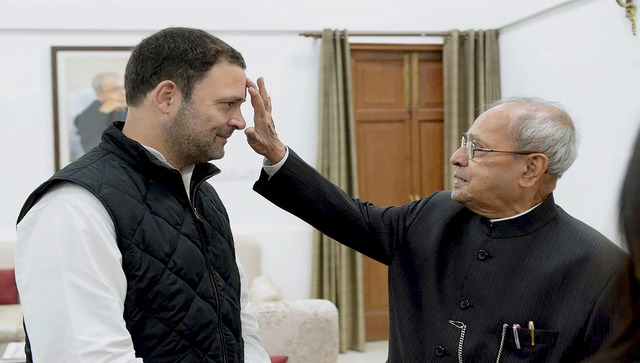 "Revealed: Why Pranab Mukherjee was ‘disappointed’ with Rahul Gandhi")