 "'Fixed it for you': Congress, BJP wage battle of infographics as saffron party seeks to downplay fuel price hike")
The Bharatiya Janata Party, which is currently facing fire over rising fuel prices across the country and the Bharat Bandh protests held over the issue, shared a series of infographics on social media on Monday in an attempt to counter the Opposition’s charges. However, the move didn’t go as planned, with Twitterati panning the graphics, which showed a downward arrow to depict a rise in prices of petrol and diesel.
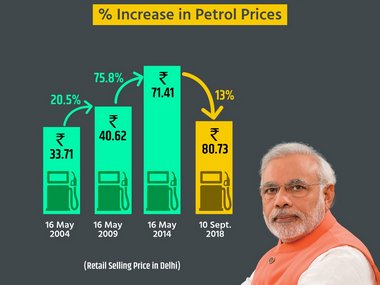
Through these graphics, the BJP contended that the percentage increase in the prices of petrol and diesel was higher during the UPA regime (2004-2014) than during the NDA one (2014-present). However, as the bars in the infographic sought to depict the prices of petrol and diesel, it went wrong by using a smaller bar to denote a higher price. It is also unclear how the party arrived at the particular height it used for the yellow bar in both cases (petrol and diesel). The Congress was quick to lampoon the infographic, remarking on Twitter: “Even we couldn’t resist retweeting this.” These were the BJP’s words from when it had retweeted images the Congress had shared of its president Rahul Gandhi from Germany.
The Congress subsequently shared an infographic of its own, arguing that the BJP’s statistics made no mention of international crude oil prices. It argued that between May 2014 and September 2018, international crude oil prices dropped by 34 percent, while in the same duration, the prices of petrol had increased by 13 percent in India. The infographic says that between 2004 and 2009, international crude oil prices had increased by 61 percent, while petrol prices had risen only by 20.5 percent at the same time.
The Congress led the Bharat Bandh observed across India on Monday in protest against the skyrocketing prices of fuel in India. The party said that as many as 21 other Opposition parties took part in the strike. It called the bandh a success and also accused the BJP of lying about the reason behind the exorbitant prices of petrol and diesel.