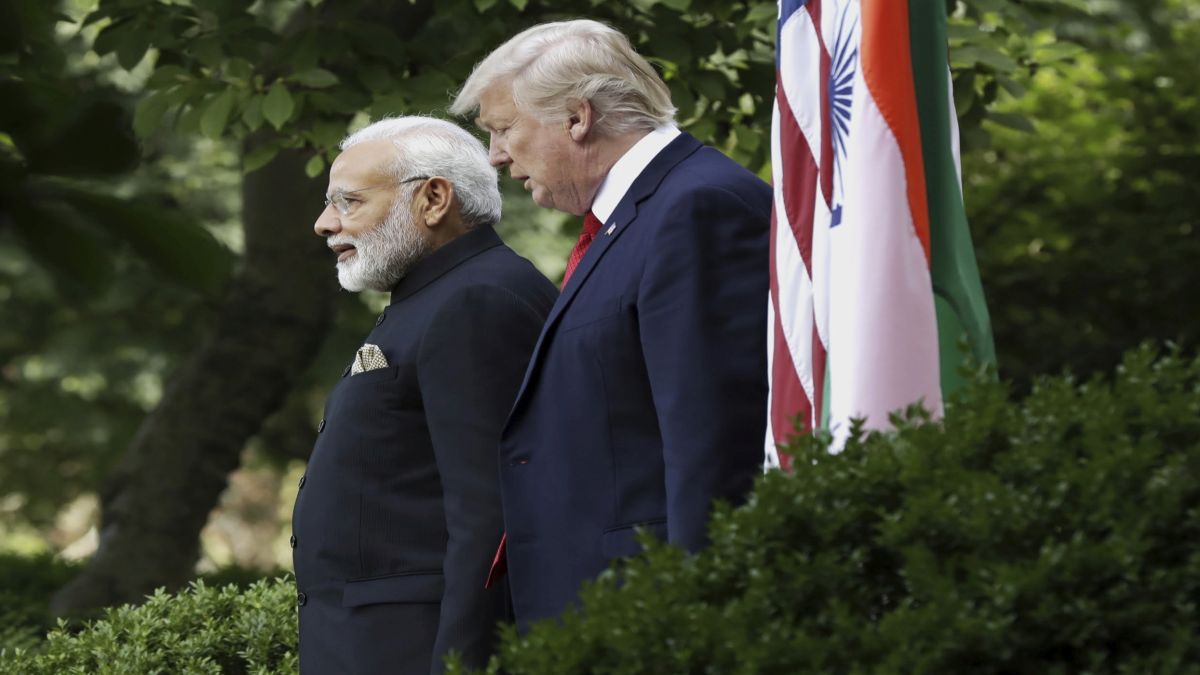
US President Donald Trump has repeatedly slammed India over tariffs.
Trump last week announced he was imposing a 25 per cent tariff on India plus a ‘penalty’ for buying Russian oil.
He has vowed to raise tariffs “substantially” over the next 24 hours and accused India of fuelling the war in Ukraine. Trump previously accused India of being a ‘tariff king’.
But does the data back Trump up? How does India compare to its Asian rivals and other nations?
Let’s take a closer look:
What does data show?
A closer look at the data shows that Trump’s claims are false.
India’s simple average tariff – which comprises levies on both agriculture and non-agriculture products – is around 16 per cent. This is in the same league as Bangladesh (14.1 per cent), Turkey (16.2 per cent) and Argentina (13.4 per cent).
However India’s weighted average tariff is only around 4.6 per cent. When looking at tariffs, it is the weighted average tariff that is deemed more important. This is because simple average tariffs measure the duty on all products, even those that make up a fraction of the goods traded. However, weighted average tariffs quantify the actual levy based on the volume of trade.
India’s weighted average compares favourably with Vietnam (5.1 per cent) Indonesia (5.7 per cent) and the European Union (5 per cent).
Of 144 nations, data shows India ranked 64 – lower than competitors such as Bangladesh, Pakistan, and Brazil.
India has also placed most of its tariffs on agriculture and automobiles – sectors that have low import volumes. India isn’t alone in protecting agriculture either. Switzerland (28.5 per cent), Norway (31.1 per cent), and South Korea (57 per cent) have also done so.
When it comes to the US, India in the 2023-24 financial year, imported goods worth $42.2 billion from the US. Almost 75 per cent of this was in 100 key products – most of which have low or negligible tariffs. For example, most of the high-volume US exports to India such as pharmaceuticals, energy products, machinery, and chemicals have tariffs ranging from five to eight per cent.
Most of India’s imports are duty free under schemes such as Special Economic Zones (SEZs), Export-Oriented Units (EOUs), and Free Trade Agreements (FTAs).
For example, India has a zero per cent tariff on semiconductors. India’s average most-favoured nations (MFN) tariff on electronics is just 10 per cent, which again compares reasonably well with Vietnam’s average MFN of 8.5 per cent.
India has also made great strides in cutting tariffs over the years. In 1990, India’s average tariff stood at a whopping 80.9 per cent. That rate was slowly brought down post liberalisation to 56 per cent. By 1999, that average tariff was at 33 per cent. By 2023, the simple average tariff had been cut in half at 15.98 per cent. In the last decade alone, India has reduced its weighted average tariff from 7.3 percent to 4.6 percent,
India cut its tariffs by over 80 percent in the period between 2001 and 2022. Conversely, EU tariffs decreased 61 percent, and Thailand reduced its tariffs by 56 percent over the same period.
Many of these cuts have benefitted the US particularly after 2023 when India brought down levies on exports such as apples, walnuts, and almonds after WTO disputes were resolved. India has also reduced its tariffs or brought them to zero on high-tech goods and solar equipment.
The US, meanwhile, continues its own protectionist stance across a number of sectors including autos, textile, agriculture and dairy.
WTO data shows that the US, despite importing just 0.1 per cent of its dairy in 2024, levied a MFN tariff of 17.2 per cent. Its top dairy tariff clocked in at a whopping 200 per cent.
The US has imposed an average tariff of 19.28 per cent on automobiles, a 23.98 per cent on cheese, between 114.8 and 164.8 per cent on peanuts, an average tariff of 114.80 per cent on tobacco and an average tariff of 197.04 per cent on sour cream.
Washington also has imposed a 132 per cent tariff on fruits and vegetables, a 164 per cent tariff on oilseeds, fats and oils, 35 per cent tariff on fish and fish products and a 38 per cent tariff on metals and minerals.
What do experts say?
They say that India, when it comes to tariffs, compares favourably with its rivals and competitors such as Bangladesh and Pakistan. India also does compares reasonably well with upper-middle-income nations with a higher per capita income like Turkey.
They say the data shows India’s trade policies have, in the long term, proved to eschew protectionism – even as New Delhi keeps in mind the need to protect its national interest and economically-sensitive sectors such as agriculture.
The data shows that India’s tariffs, particularly on agriculture, are perfectly in keeping with what other nations are doing around the world. The US, with its own high tariffs and protectionism, is in no position to lecture India.
They also say non-tariff barriers, which many view as a means to protect domestic interests, are more difficult to quantify. However, here once again the US argument completely falls apart.
For example, the United Nations Conference on Trade and Development (UNCTAD) in 2020 conducted a survey on non-tariff barriers in Asian nations. India on this survey fared better than Japan and South Korea – which the US has treated rather well when it comes to tariffs.
China, which is also in negotiations with the US with the Trump administration making conciliatory noises, had a score nearly twice as high as India. China is said to have more than 2,600 non-tariff measures (NTMs), many of which sources have described as intricate and complicated. They say the US under Trump is pushing a narrative that the facts simply don’t bear out and that India is being unfairly targeted.
With inputs from agencies
)