
 "Sensex, Nifty hit new high: Investors should sit tight and ride the wave with quality stocks")
Sentiment analysis: The strength of the bullish vigor was clear when the market responded to Bharti Airtel’s fourth quarter results. The company reported 72 percent decline in profit but the stock jumped 8 percent that day. Even Zensar Technologies declared 84 percent decline in fourth quarter profits, the stock fell by 8 percent but within next 3 days recovered the entire loss and bounced back to the pre result levels. [caption id=“attachment_2744028” align=“alignleft” width=“380”]  Reuters[/caption] Tyre companies like Ceat and Apollo Tyres reported declines in their fourth quarterly and annual numbers but the stocks are still holding on to their recent gains of around 50 percent and more since demonetisation. Cement companies too have posted muted numbers for the current quarter but still the stock prices are scorching ahead as if there is huge shift in their fundamental numbers. All these indicate that we are in a solid bull market. Irrespective of the fundamentals, stock prices are moving higher and higher on hopes and expectations that the earnings will catch up later, as the economy expands. But the million dollar question is when will the market reach the epitome of euphoria and fall thereafter? How long will this continue? When will the bullish sentiments reach its epic point? Macro economic analysis: That being the case let’s see where the market currently compares vis-à-vis the period of January 2008 when the Nifty and Sensex had made major top of the decade and thereafter turned into a severe bear market.
| Particulars | January 2008 | April 2017 |
|---|---|---|
| Trailing P/E Nifty 50 | 27.62 | 23.63 |
| Trailing P/B Nifty 50 | 6.39 | 3.55 |
| Market cap to GDP ratio | 1.49 | 0.80 |
| Capacity utilisation | 91.7% | 72.7% |
| Credit growth | 23.3% | 5.1% |
| Index for Industrial Production (IIP) 12 months | 15.58% | 5% |
| GDP growth | 9.6% | 7.2% |
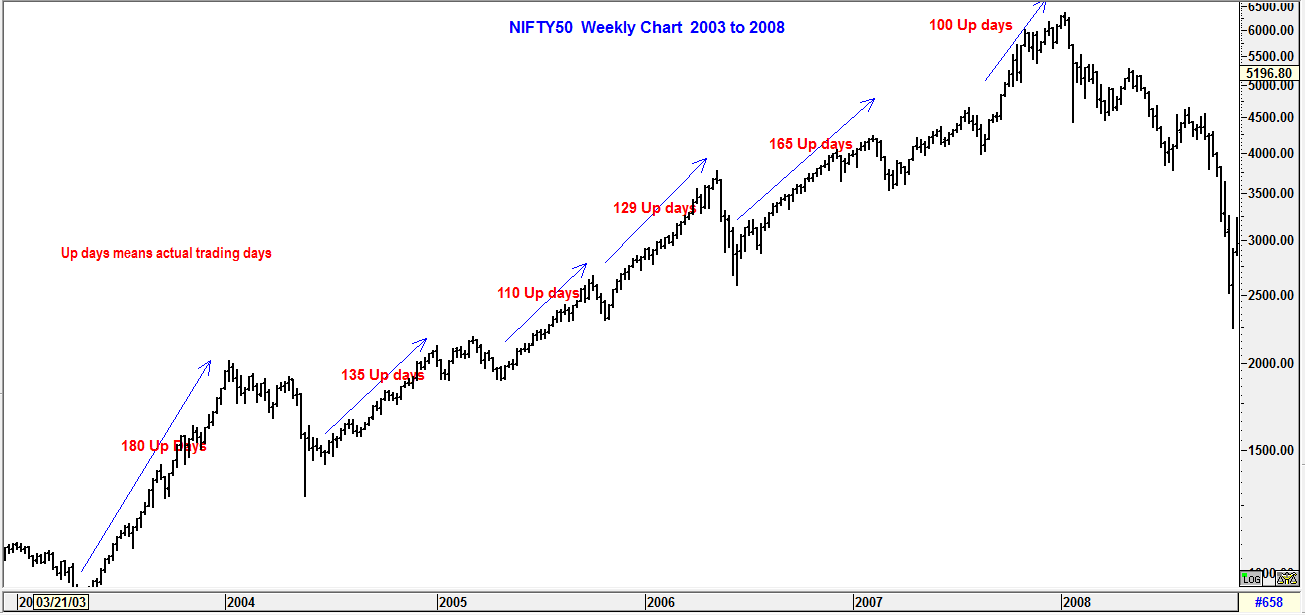
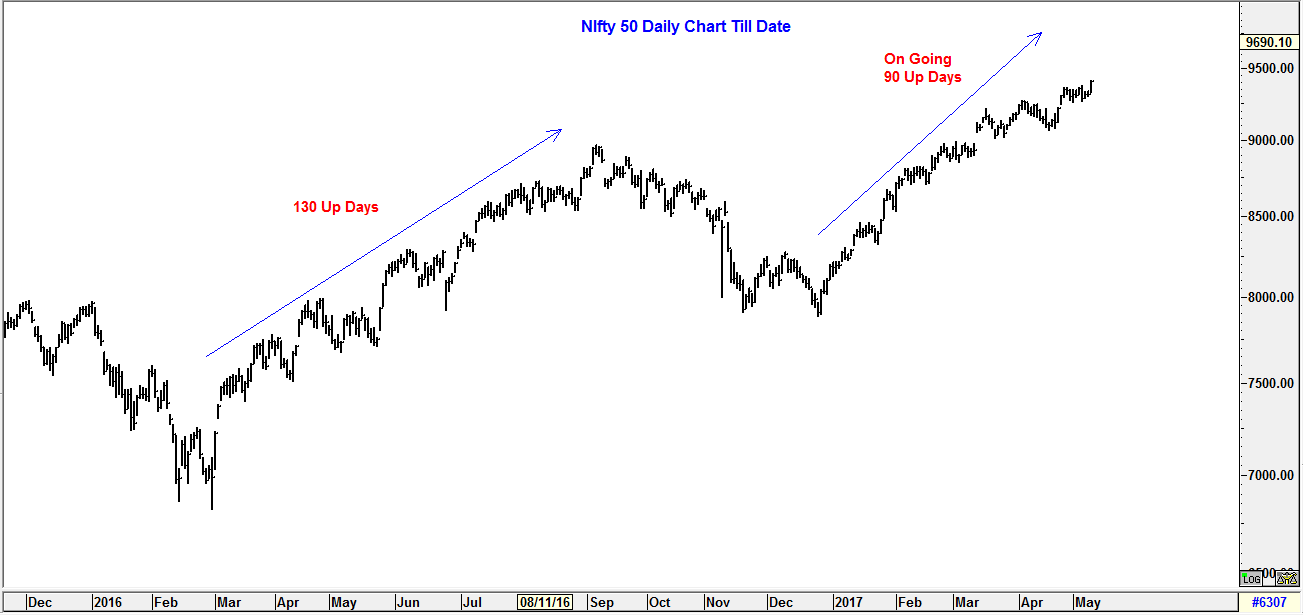
It can be seen the market currently is nowhere near the euphoric tops either in terms of valuations or in terms of stretched macroeconomic fundamentals. There is a long way to go before the economy reaches near its full capacity utilisation, increasing capex, huge demand for capital fuelling credit growth and IPOs in the market. More and more people will join the capital bandwagon which today is paltry 3 percent of the population compared to average 12-15 percent in other emerging markets. The continuing bull momentum should lead to super excesses in the system, which will then result in ultimate bull market top. But that’s still years away, it seems. But until that time, the investors will have to sit tight and ride the wave. That is the biggest secret to make money in such kind of secular bull market. Right stock picking should be a lesser worry. Investors as an alternative should invest in Index ETFs for superior returns. Technical analysis: Parallels in the history for the current bull market can be drawn when we see current price action structure of the market. Looking at the nonstop rally without correction, it can be safely concluded that the current bull market rally clearly resembles the secular bull market that India had witnessed from 2003 to 2008 and which the US had witnessed from 1945 to 1960. The most significant characteristic is the number of days of the primary uptrend. In secular bull markets, the average period of uptrend lasts for 135 days. In India this was the case during 2003 to 2008 supersonic bull market. Chart A depicts the 2003 to 2008 market structure. Chart A

 "US ready to ‘impose costs’ on Russia if war in Ukraine drags on, says Hegseth")
 "US tells Hamas to stop violence against Gaza civilians and disarm 'without delay'")
 "China seizes 60,000 maps mislabelling Taiwan, omitting South China Sea islands")
 "Syria’s Sharaa pledges to honor Russia ties, seeks economic and military support in Kremlin visit")


](https://images.firstpost.com/wp-content/uploads/2016/04/bse-reuters121.jpg)