 "Key takeaways and broad emerging trends from Uttar Pradesh election results 2022")
The highly awaited Uttar Pradesh Assembly elections resulted in a decisive mandate in favour of the Bharatiya Janata Party (BJP), making Yogi Adityanath the first Chief Minister in 37 years to win a consecutive majority in the state.
There has been a lot of commentary and analysis on the supposed performance of parties within various communities and what they could have done better. This article takes a broader view and looks at some plain data-based trends that have emerged from the election results, and how the parties fare in comparison with previous results.
Bipolar competition between BJP and SP
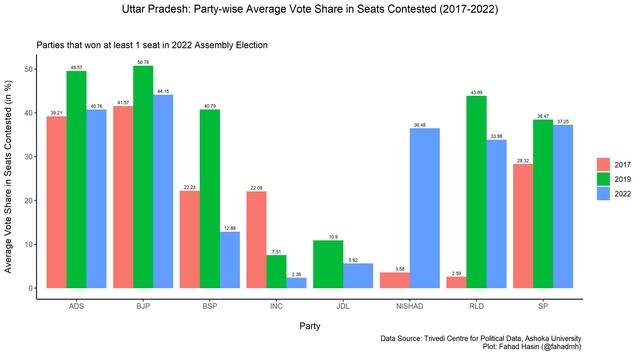
Figure 1
There are three key insights from the vote share of the main parties (Figure 1): First, there is a slight drop in the BJP’s vote share as compared to 2019. This is not surprising as the BJP tends to underperform in state elections as compared to national elections. It is noteworthy that the vote share of the party has actually gone slightly up from the previous Assembly election despite the incumbency.
Second, the Samajwadi Party (SP) has been able to significantly increase its vote share from the last Assembly election. Note that the party fought the 2019 general elections in alliance with the Bahujan Samaj Party (BSP). This time it fought mostly alone, barring alliances with smaller parties in some seats. Hence, the SP has made significant improvement compared to its performance in the last Assembly election which included the Indian National Congress (INC) in the alliance as well.
Third, the steady decline of INC and BSP is very clear, winning only two and one seat(s) respectively. It appears that a significant proportion of these voters have moved to the SP as indicated by its increased vote share. However, despite its highest ever vote share in an Assembly election, the SP did not get the majority as it failed to swing votes from BJP. The BJP held on to — even consolidated — its vote share.
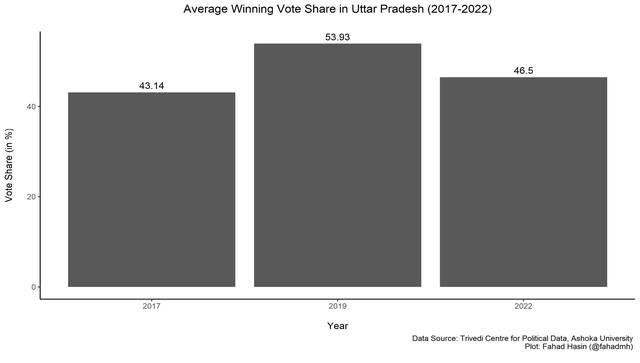
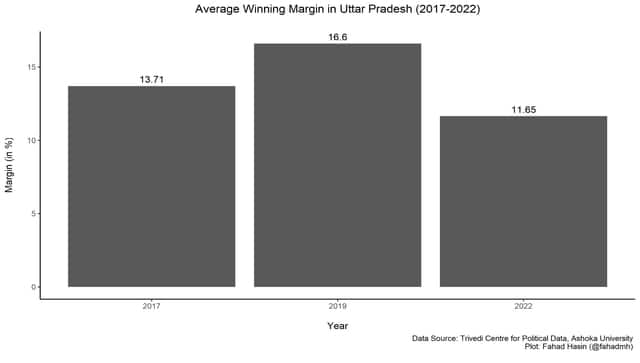
In the 2019 general election two of the three key players — SP and BSP — had formed an alliance, making it a bi-polar between the alliance and BJP. As a result, the average vote share required to win was very high in that election. This time, despite the SP, BSP and INC fighting separately, the average winning vote share is higher from the last Assembly election (Figure 2). At the same time, the average winning margin is much lower as compared to earlier elections (Figure 3). Taken together, all of this indicates the bipolarity of the contest in the 2022 elections, with SP and BJP emerging as the only meaningful players.
Figure 2
Figure 3
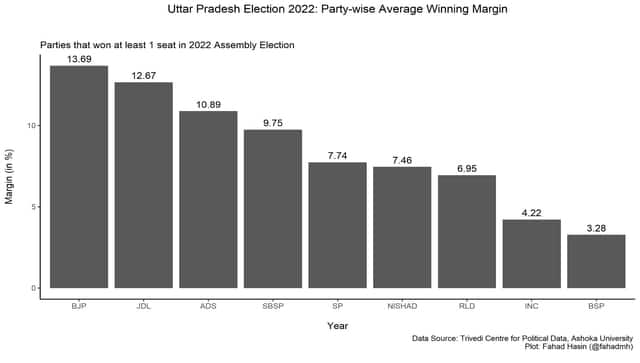
On average, the BJP candidates won with the highest margins, almost double that of its primary opponent, SP. Even for the 2 and 1 seat (s) that INC and BSP won respectively, they did it with very low margins (Figure 4). This shows the clear and decisive advantage that the BJP holds over others in the state.
Figure 4
Individual candidates still matter
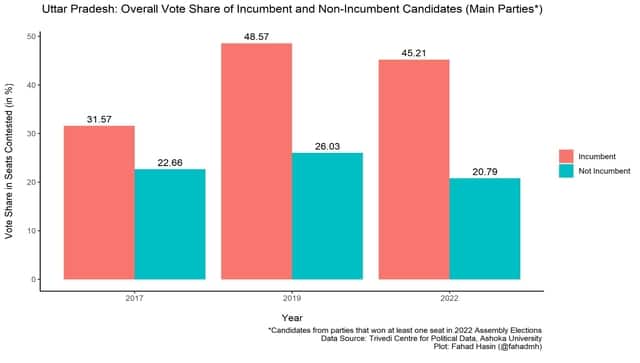
A much-talked about phenomenon in Indian politics is anti-incumbency and this election was no different. In particular, there was a strong narrative of high anti-incumbency at the ground level, substantiated by stories like that of BJP MLAs being chased away out of their constituencies by an angry public. Yet, generally speaking, the data shows that incumbent candidates (sitting MLAs) have consistently performed better over years. (Figure 5)
Figure 5
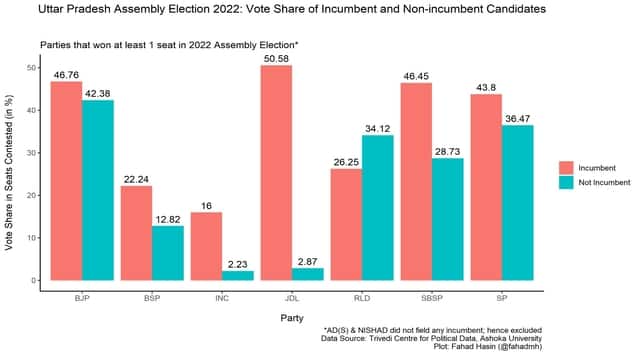
Overall, 200 incumbents contested this election, out of which 143 won. This is an impressive strike-rate of 70 percent as compared to 30 percent in the 2017 Assembly election (64% in 2019 general election). Except in the case of Rashtriya Lok Dal (RLD), incumbents have performed better across parties in this election, including the ruling BJP (Figure 6).
To be sure, this could be because the parties try to identify candidates with high anti-incumbency and deny them the ticket, fielding only strong incumbent candidates with high winnability. In fact, the BJP denied tickets to many incumbents this election — it fielded only 149 incumbents out of the 376 seats it contested this time. However, given that the pattern holds for almost all parties and across different elections, a more plausible explanation appears to be that candidate-level incumbency is highly overstated.
Figure 6
Similarly, candidates that have contested an election before performed systematically better than first-time candidates (Figure 7 and 8). The difference is stark across recent elections. It suggests that candidates who have plausibly more experience with campaigning — as a result of having contested before — tend to perform better on average. Hence, despite the increasingly centralised nature of politics and elections in India, the individual candidates still seem to matter.
Performance of female candidates
As with most recent elections, there has been a lot of discussion over the role of female voters but little about the female candidates. The representation of women in law-making at both the centre and states is abysmally low. The key reason for it is that parties usually refuse to give tickets to women candidates citing issues of ‘winnability’.
A party-wise breakdown for this election shows that the performance of male and female candidates is very similar for two main players, SP and BJP (Figure 8). The gaps are higher for RLD, JDL and SBSP, likely because of idiosyncratic factors in the small number of seats they contested. Female candidates within AD(S) and BSP performed better than their male counterparts. Overall, only 285 out of 1620 candidates (~18%) from main parties* were female.
Going by the performance of female candidates in some recent elections in the state, the concern about the so-called ‘lower winnability’ of female candidates seem mostly unfounded (Figure 9). Female candidates from main parties* performed almost the same as their male counterparts in 2017 (with slightly higher vote share) and 2019 (with slightly lower vote share).
The drastic decrease in the vote share of female candidates in this election is primarily because most of them (54 percent) belonged to the INC, which performed poorly overall. If the INC is excluded from the analysis, the average vote shares for male and female candidates from main parties* are 30.65 percent and 31.83 percent respectively for this election.
As parties set a high bar for giving tickets to women, there could be some selection bias here. It is, however, also counterbalanced by the phenomenon wherein parties field women candidates as a token gesture in constituencies they are anyway weak (and likely to lose). Hence, the data should make parties more confident in giving a much higher share of tickets going ahead in the state.
_________________________________________________________________________
*For the sake of simplicity, main parties include parties that have won at least one seat in the 2022 Assembly Elections. These are: AD(S), BJP, BSP, JDL, INC, SBSP, SP, NISHAD and RLD.
The author writes on politics, public policy and society and is an Associate at IDinsight. Views expressed here are entirely personal and do not reflect the position of any organisation the author is associated with.
Read all the Latest News , Trending News , Cricket News , Bollywood News , India News and Entertainment News here. Follow us on Facebook , Twitter and Instagram .