
 "When the world gets richer, inequality becomes uglier: Why India cannot escape the trend")
An eventful year, 2025, ends, opening the door for its progeny, 2026, to take birth, grow in full bloom, fade and die exactly a year later. But the change in calendar may not necessarily see the change in political discourse anywhere in the world. Leaders largely remain the same — except with a headline-hogging incoming New York City mayor Zohran Mamdani — with the same set of agenda to grab or stay in power. India is also unlikely to be an exception.
So, when I saw a post by efficiently vocal Member of Parliament (MP) from Bihar’s Rashtriya Janata Dal (RJD) — which recently got a serious drubbing at the hands of Prime Minister Narendra Modi’s Bharatiya Janata Party (BJP)-led coalition in the assembly election — Manoj Jha blaming the incumbent government in New Delhi for the growing economic inequality in India, I dug into some reports, data by global organisations, opinions of experts and numbers to understand who is to be blamed for such inequality.
मा. प्रधानमंत्री जी @PMOIndia
— Manoj Kumar Jha (@manojkjhadu) December 31, 2025
किसी भी अर्थव्यवस्था की महानता इस बात में नहीं होती है कि शीर्ष एक प्रतिशत कितना समृद्ध है, बल्कि इसमें कि श्रमिक वर्ग कितनी असुरक्षा और अनिश्चितता से मुक्त जीवन जी रहा है।
जय हिन्द pic.twitter.com/DYTywNNd7X
This exercise was also necessitated by the fact that Manoj Jha has been a career professor of social work who has taught at India’s premier institutions. Global experience of national development suggests that if a country grows economically, it does not care for sociology or socialism.
How do G7 and OECD countries fare on inequality?
Across the G7 and OECD, long-term trends show inequality increasing. McKinsey noted in a 2019 publication that “wealth and income inequality in general has been rising since the 1980s” in many advanced economies. For example, from 1980 to 2014 the top one per cent share of disposable income in the OECD roughly doubled (from ~6 per cent to ~11 per cent).
Wealth inequality is even starker: in 2014 about 27 per cent of G7 national wealth was owned by the top one per cent, versus only ~13 per cent of income. While not all OECD countries moved in lockstep, the majority saw rising inequality. In two‐thirds of OECD countries, average wealth dispersion (measured by mean‐to‐median wealth) increased from 2000 to the 2010s, McKinsey report said.
Notably, countries hit hard by recent crises – Ireland, some Eastern European economies (Latvia, Slovenia), Switzerland, and the United States – saw significant Gini increases in wealth. However, by contrast, Belgium, Poland and Sweden bucked the trend and saw wealth inequality decline.
But the rule no.1 is: The top-tier rules
Income shares likewise reveal steep top‐end gains. In the US, for instance, the top one per cent share of pre-tax income grew from about 10–11 per cent in 1980 to roughly 20 per cent by the 2010s. The US Federal Reserve reports that as of 2024 the bottom half of US households hold only ~2.5 per cent of total wealth, while the top one per cent hold ~30.5 per cent — a gap that has widened substantially since 1989.
Similarly, UK official data show the richest one per cent income share rising from about 7 per cent in 2011 to 8.2 per cent by 2020 even as the poorest half’s share has remained around ~15–20 per cent. Across Europe, OECD and IMF analyses find increasing inequality in nearly all G7 countries, driven by factors like rising top salaries, capital returns and weakened progressive taxation.
What’s happening in emerging economies — China, India and Brazil
Rapid-growth economies have often seen exceptional increases in inequality alongside rising GDP. In China, decades of growth have lifted billions from poverty but also concentrated wealth at the top. The World Inequality Database ( WID) analysis shows that China’s bottom 50 per cent share of wealth plunged from over 16 per cent in 1995 to just about six per cent by 2021.
By 2017 even China’s ultra-wealthy (top 0.001 per cent) owned more wealth than the entire poorest half of the population. The top 10 per cent richest Chinese now hold nearly 70 per cent of the country’s total personal wealth. Income inequality in China likewise climbed (World Bank Gini ~0.47), as urbanisation and industrial gains disproportionately raised high earners’ incomes.
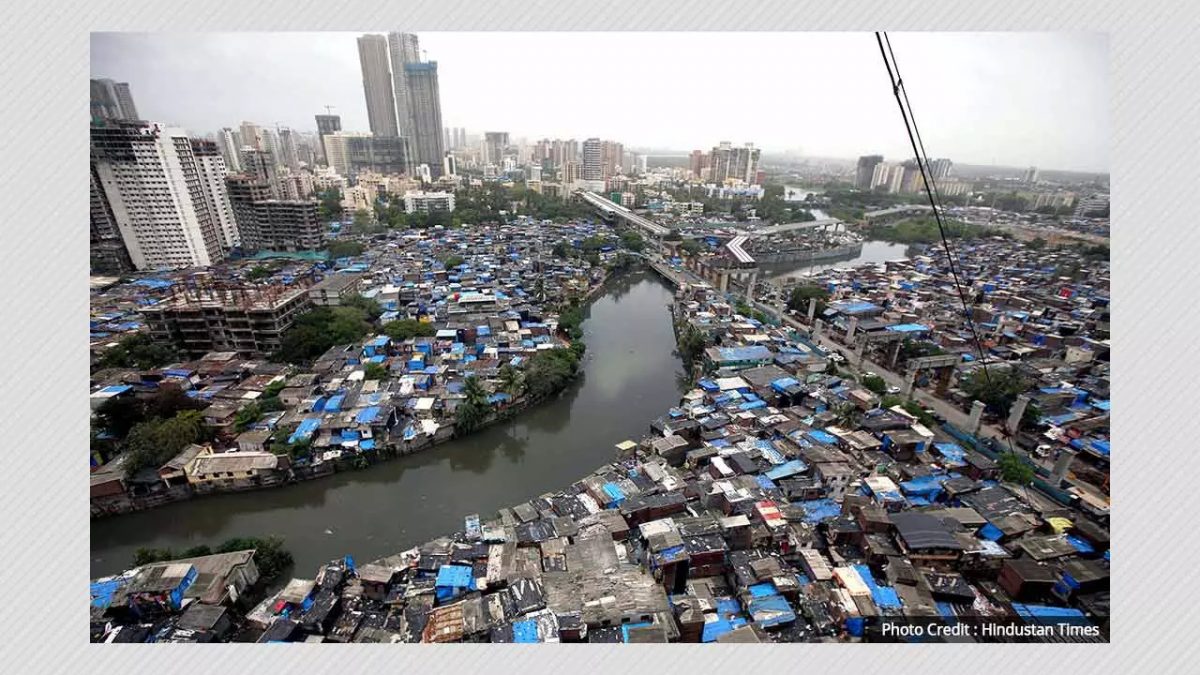
In India, inequality has soared in recent years. A 2024 WID study found that by 2022–23 the top one per cent earned about 22.6 per cent of India’s income (the highest level on record) while the bottom 50 per cent earned only about 15 per cent. In 1990, India’s bottom half earned about 22.4 per cent vs the top one per cent at only about 10.5%.
The wealth gap is even larger: in 2022–23 India’s richest one per cent held about 40.1 per cent of wealth, while the bottom 50 per cent held only about 6.4 per cent. In other words, the average wealth of those in the top one per cent is on the order of 40 times that of the average individual in the bottom half.
Brazil too remains one of the world’s most unequal countries. Historical data combining surveys and tax records indicate the top one per cent income share was around 25 per cent in the early 2000s and grew to about 28 per cent by 2015.
The poorest half of Brazilians earned only about 11–12 per cent of national income during this period. Notably, social programmes in the 2000s raised incomes of the poor, slightly increasing the bottom 50 per cent share from 11 per cent to 12 per cent, but this was far below the increase in top shares.
Wealth is even more concentrated: roughly 40 per cent of Brazil’s wealth is owned by the top one per cent, while the bottom 50 per cent holds around one-two per cent (estimates vary).
In sum, India, China and Brazil — despite rapid economic growth — all exhibit widening gaps between their richest one per cent and poorest 50 per cent in both income and wealth.
What happens in countries with stagnant or low growth
Even in countries without recent growth, inequality has often not improved. In many cases, low or negative growth has coincided with sharpening disparities. IMF research warns that prolonged stagnation tends to push up inequality. Periods of four or more years of very slow growth have been found to raise within-country income inequality by roughly 20 per cent on average, an IMF blog published in 2024 said.
The logic is that sluggish growth suppresses wages and employment (hurting the bottom 50 per cent), while asset-rich elites can still capture gains.
For example, Italy — a wealthy OECD country with nearly zero GDP growth since the 2000s — saw its bottom half’s wealth share collapse. The poorest 50 per cent of Italians owned 11.7 per cent of national wealth in 1995, but just 3.5 per cent by 2016, while the very richest 0.1 per cent saw their share double, the Stone Center study shows. In effect, Italian bottom households lost four-fifths of their relative wealth in two decades.
Greece — also hard-hit by stagnation and austerity — experienced similar effects: the richest one per cent now hold roughly as much wealth as the poorest 50 per cent, a study by The Journal of Economic Asymmetries showed.
On the other hand, some East Asian economies such as Japan have seen only modest rises in inequality. Japan’s income Gini has crept up slightly since the 1990s due largely to ageing and part-time work, but remains lower than in the US or the UK. Still, Japan’s bottom 50 per cent share of wealth is also tiny and its top 10 per cent wealth share high, in keeping with other developed economies.
In poorer regions, limited growth often coexists with entrenched inequality. Many sub-Saharan African countries or conflict-affected states have scant data, but available studies suggest persistent high inequality even where incomes stagnate. For instance, West Asian and North African oil states have extremely high wealth gaps (with the top one per cent controlling large resource rents) despite volatile or flat growth.
Latin America’s growth plateau after 2015 has risked undoing some gains: a 2023 WID analysis finds that while income inequality had fallen across the 2000s, trends flattened or even reversed in recent years once the gains to the top 1% are counted.
So, what does income inequality dynamics say about drivers?
The pattern across countries is that rising inequality is common but not uniform. In most advanced and emerging economies, the top one per cent income share has increased while the bottom 50 per cent share has fallen or stagnated. This gap tends to widen especially in periods of high growth skewed toward capital (e.g. tech booms, commodity booms) or in slow-growth settings, where the bottom’s incomes stall.
There are, though, exceptions — a few countries have stable or declining inequality thanks to redistributive policies — but these are rare.
Let’s break down the anatomy of inequality:
Income vs wealth
Wealth inequality typically far exceeds income inequality. As McKinsey observes, “within inequality there is a hierarchy”: top wealth shares are more unequal than top income shares. Globally, the richest one per cent own about one-third of wealth vs only about 20 per cent of income, a WID report says.
Thus, the widening gaps at the top translate into enormous disparities in wealth ownership. For example, an EU-funded 2024 study noted that in Brazil and Argentina — two of the highly unequal economies — the richest one per cent own roughly as much wealth as the bottom 50 per cent combined.
The reasons are similar: financial assets, property and stocks have grown faster than wages, and tax policies often benefit capital.
Economic drivers
Technological change and globalisation have boosted the returns to high skills and capital owners, increasing top incomes. Firms have gained market power, widening profit shares. Financial markets’ growth, especially through the 2010s, poured wealth into portfolios of the rich. In many emerging markets, the shift from agriculture to industry and urbanisation dramatically raised high-end incomes (e.g. real estate moguls and business owners in China or India).
Conversely, slow growth hurts labour’s share. The IMF highlights that stagnation tends to erode wages and jobs, so labour’s share falls and the rich capture a higher fraction. Recessions and crises can also accelerate inequality: the 2008–09 financial crisis saw asset prices recover faster for wealthy investors, widening wealth gaps. The US Federal Reserve noted that the top one per cent lost only 11 per cent of wealth versus 36 per cent for the median during 2007–09.
Even the Covid-19 shock had mixed effects: pandemic aid kept many lower-income people afloat, but stock-market and tech-sector booms enriched the top.
Policy and structural factors
Political choices have significantly shaped trends. Since the 1980s, most countries have cut top tax rates and weakened progressive redistribution. An OECD study notes that in the 1970s many countries had top personal income tax rates of 70 per cent or more, but by 2013 these had often been cut in half.
Declining unionisation and deregulation of labour markets have compressed wages. Fiscal austerity in recessions has further trimmed social programmes that benefit the bottom half.
On the structural side, demographic shifts such as ageing populations shifting income to pensions and assets, lower fertility, urbanisation, and changes in household composition can affect distribution. For instance, a larger share of elderly retirees can widen measured inequality if pensions are flat.
Geography and institutions matter too. Countries with inclusive institutions and safety nets – e.g. Nordic Scandinavia — have successfully contained inequality. In contrast, economies reliant on commodity rents such as Russia or Gulf nations, or with weak land reforms often concentrate wealth at the top. Public-asset privatisations in the 1990s as seen in Eastern Europe and Latin America, often created new elites. Financial crises such as that of 1997 in Asia and 1998 of Russia also reshuffled wealth upward.
So, what do we get?
Inequality has overwhelmingly grown in most rich and fast-growing economies, but the extent varies by country and over time. Among G7 and OECD nations, rising top-one per cent income shares and record-high wealth concentration have been the norm, with only a few welfare states seeing much progressivity.
In major emerging economies such as China, India and Brazil, rapid GDP growth has coincided with record inequality — the richest fractions grabbing very large income and wealth shares.
By contrast, countries with stagnant or contracting growth such as Italy, Greece, and parts of Latin America have often seen the bottom half’s share fall even further, sometimes dramatically. The consistent pattern is that inequality is rarely decreasing in market-driven economies without strong countervailing policies. Wherever it has fallen, it has typically been due to explicit redistribution, wage compression at the top, or extraordinary shocks as in some Latin American cases in the 2000s.
Across the board, rich economies show the top share much larger than the bottom’s. For instance, in 2021 the bottom 50 per cent of Americans held just two-three per cent of wealth, whereas the corresponding figure is only slightly higher in Europe. In emerging economies it is similarly low. China and India are no exception.
These skews reveal the widening gap in economic outcomes: while everyone may be better off in aggregate, a disproportionate share of gains accrues to the very top.
Overall, inequality has tended to rise more often than not, especially in dynamic market economies. The long-term pattern is clear: growth begets inequality and that it is not a guarantee of equal distribution of income or wealth.
In fact, technological and financial changes often amplify market returns to the affluent. Closing the gap requires concerted fiscal and social measures (progressive taxes, public services, fair labour policies) — a theme highlighted by the IMF and OECD as crucial to inclusive growth policy — an emphasis area of the current and the previous Indian government. Brazil’s G20 presidency also prioritised addressing inequality.
India, as the world’s fastest-growing major economy, is passing through the same phase in its evolution where it follows the logic of history — which, on evidence, shows that the richest top tier has generally pulled ahead of the bottom 50 per cent in both income and wealth across societies and nations. It is a trend seen in advanced G7 nations, major developing economies, and even many lower-growth regions. India is unlikely to escape this predicament of the fast-paced growth that the people and the government aim to achieve.

 "A fractured world: How coups, conflicts and fragile truces disrupted the global order in 2025")
 "Kiribati, New Zealand, Australia: Which countries are the first to ring in 2026?")
 "'We believe in you and our victory': Putin sends New Year message to Russian troops in Ukraine")
 "‘True strength’: China lauds India as economy marches past Japan to emerge world's 4th largest")


