
 "View from Abroad | Electoral manipulation and the perils of small-N research")
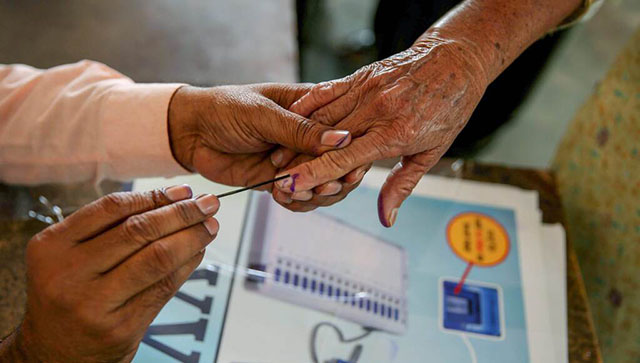
An academic paper is making headlines, and India should be proud. It’s a rare country where a fifty-page econometric analysis of voting patterns is national news. India really is the true home of the serious intellectual. The paper, ‘Democratic Backsliding in the World’s Largest Democracy’, by Sabyasachi Das of Ashoka University, is a masterful exhibition of mathematically driven economic reasoning. It is painstaking, careful, and precise. The young professor Das clearly has a bright future ahead of him. Unfortunately for critics of the BJP (but fortunately for Indian democracy), the paper’s conclusions are likely to be entirely wrong. The paper relies on a statistical technique called a “regression discontinuity design” (RDD) model. The basic idea of the RDD model is that if you focus specifically on close elections, those that turn on a knife’s edge, roughly half should go each way. If instead you find that most of the “close” elections are being won by the party in power, that’s possible evidence of vote tampering, voter suppression, or some other form of electoral manipulation. The Das paper finds exactly this kind of result for the 2019 election. Studying the electoral outcomes in each of India’s 543 Lok Sabha constituencies, Das concluded that in “a closely contested election … [the] BJP was significantly more likely to win that election than lose”. How significantly? Well, not very significantly. This headline finding was within a hair’s breadth of being “not significant” by the conventional standards applied by statisticians. Had a single closely contested election gone the other way, the headline results (Table 1) would have been non-significant. That’s not a very convincing finding. Statistical significance is a slippery concept. Statisticians usually ask, “What is the probability that an observed result could have occurred purely at random?” If the probability obtained from a statistical model is less than 5 per cent, we say that the result is “significant” — i.e., it is unlikely to have occurred at random. In fact, Das calculated his key statistic for 21 distinct sets of election results going back to 1977 and found that “the BJP win margin in 2019 is the only case exhibiting statistically significant” irregularities. To the non-expert, that must sound very convincing. The expert will immediately notice that for every 20 analyses a researcher conducts, one analysis will turn out significant purely at random. If that one random significant result had been for 1977 or 2004, no one would care. If it’s for 2019, you have yourself a paper. There are many minor points in the Das paper on which statisticians can (and surely will) quibble. But when it comes to the big headline results, they really do come down to the fluttering of a feather. There might be something there, or it might just be random error playing tricks on us. And that’s the danger of basing sweeping implications on analyses of very small samples. There may be 543 seats up for grabs in the Lok Sabha, but the analyses presented in this paper only focus on just 59 of them. Even worse, the detailed analyses focus on the 22 constituencies that the BJP won in “BJP ruled” states. And of those 22 wins, 16 were in Uttar Pradesh. The result is that, in effect, all of the explanatory power in the models presented by Das are driven by the 2019 success of the BJP in UP. Everyone knows that the BJP poured massive resources into the state in 2019. And everyone knows that the Chief Minister, Yogi Adityanath, is an unpredictable wild card in any election. Das defines a “close” election as one in which the winning margin is less than 5 percentage points. Considering that roughly 1 million people vote in each UP Lok Sabha constituency, that means a potential swing of 50,000 people per constituency. If, as Das suggests, as many as 11 constituencies may have been swung by the disenfranchisement of Muslim voters, that implies poll irregularities on a massive scale. Yet the (unsubstantiated) allegations of the mass disenfranchisement of Muslims in the 2019 elections focused on Assam, where the BJP won only one of its close elections, not on UP. Allegation of voters being turned away in UP ran into the tens per constituency, not the tens of thousands. For the paper’s conclusion that there was “targeted electoral discrimination against India’s largest minority group — Muslims” to be taken seriously, critics have to fund upwards of half a million disenfranchised Muslims in Uttar Pradesh. They may be there, but it will take solid investigative reporting — not fancy statistics — to find them. In the meantime, pundits should be wary of the “charisma of statistics”: the tendency to believe statistical results, simply because they are statistical results, and few people understand statistics. Das certainly understands his. But hopefully he is sophisticated enough to understand just how tenuous his results really are. The author is an associate professor at the University of Sydney and the executive director of the Indian Century Roundtable. Views expressed in the above piece are personal and solely that of the author. They do not necessarily reflect Firstpost’s views. Read all the Latest News , Trending News , Cricket News , Bollywood News , India News and Entertainment News here. Follow us on Facebook, Twitter and Instagram.
Why the conclusions of ‘Democratic Backsliding in the World’s Largest Democracy’, a paper by Sabyasachi Das of Ashoka University, are likely to be entirely wrong
Advertisement
End of Article

 "Russian drones over Poland: Trump’s tepid reaction a wake-up call for Nato?")
 "As Russia pushes east, Ukraine faces mounting pressure to defend its heartland")
 "Why Mossad was not on board with Israel’s strike on Hamas in Qatar")
 "Turkey: Erdogan's police arrest opposition mayor Hasan Mutlu, dozens officials in corruption probe")


