
 "Sensex inches out: A 500-point rise should be possible")
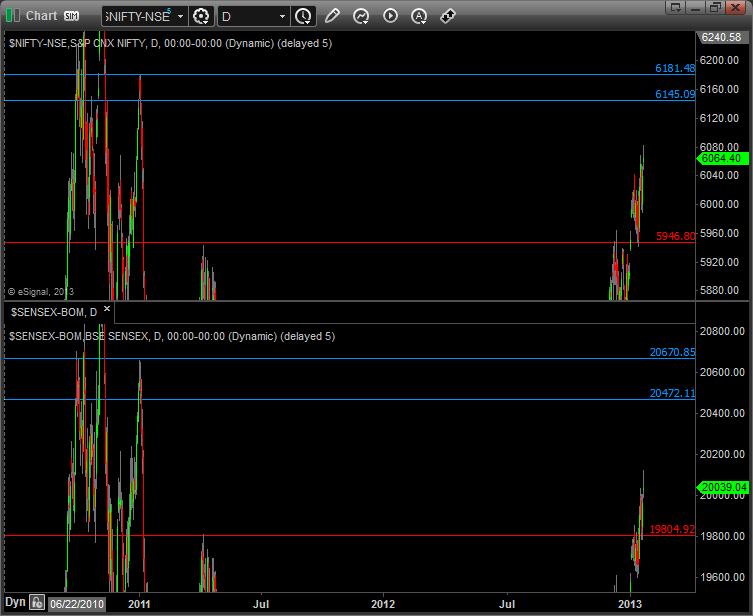
The Sensex inched higher out of a key resistance, following the Nifty, which had already cleared its resistance a couple of weeks ago. This clears the way for a potential 500-point rise in the Sensex to 20,500 and the Nifty can reach 6,150.
Resistance areas are where the supply of stocks exceeds demand, leading to a drop in price. Once price clears a resistance level it tends to head higher to the next level of supply. Two weeks ago, the Nifty cleared its resistance level of 5,955, but could not rally higher as the Sensex was not able to clear its level of 19,800. This week the Sensex slowly went above its level of resistance, clearing the way for the markets to go to the next level of supply. The resistance levels that were cleared are marked in red horizontal lines on the charts and the next supply zone where the indexes are likely headed are shown in blue horizontal lines. ( Click here for the combined chart of Sensex and Nifty ).
The Sensex and the Nifty tend to move in tandem, but for the last resistance zone they did not. But since both indexes cleared resistance, the markets can make it higher. To read more about the dance of the Nifty and the Sensex, check out our article from two weeks ago titled, "Two to tango: Nifty ready to rally, Sensex says not yet."
[caption id=“attachment_594176” align=“alignleft” width=“380”]  As the market is nearing all-time highs, it is time to take a short-term view. AFP[/caption]
We had also mentioned last week that a rally in the equity markets without a rally in the copper market is suspect. The copper market has still not rallied, which makes the equity market rise dubious. However, with the Sensex and Nifty breaking out of resistance levels, one could be a cautious equity bull and keep an eye on the copper market for any distress signals. For more on the copper equity link read last week’s article, "Can equity rally when copper is refusing to confirm it?"
As the market is nearing all-time highs, it is time to take a short-term view. The Sensex and the Nifty had fallen in 2010 after touching the all-time high of 2008. Could we see a repeat? Maybe or maybe not, but past price action tells longs to be cautious. This may be the opposite of what will be heard in the market rising to its previous all-time highs. There will be a chorus of analysts making buy recommendations. The retail public will be bullish, the TV pundits will talk about the great India story and your shoeshine boy will be recommending stocks. All jazz created around stock markets near all-time highs will tempt many to abandon caution and jump headlong.
This is the time to be cautious. That means using smaller than usual position sizes and having tighter stops. For instance, if a Nifty trader usually takes a position of four or five contracts it would be better to switch to two or three contracts. We generally have stops below support areas on a daily chart when swing trading. However, when markets are nearing strong resistance areas, we switch to having stops below support areas on a 60-minute chart. The disadvantage of stops on a 60-minute chart is that one can get stopped out easily. The advantage, on the other hand, is that if the market indeed turns near all-time highs, tighter stops will get you out early and with a better profit margin.
The path for both the indexes to their next level of supply is relatively clean. There is no major resistance area before 6,150 for the Nifty and 20,500 for the Sensex from last Friday’s close. This is so as the price fell from those levels in January 2011 quite sharply. Generally, when prices fall straight down without consolidating, they also tend to rise fast in that price range. The reason for this is slightly counter intuitive.
When prices fall sharply in a certain range, sellers far exceed buyers. Now think about this. A current seller is a future buyer and the current buyer is a future seller. So when prices come back up to a fast-moving range, since there were fewer buyers then, there are fewer sellers now. And since there were more sellers then, there are more buyers now. As a result prices move through the buyer-supply imbalance pretty quickly. It is only when buyers and suppliers are in balance that markets don’t move and consolidate. Since the Nifty and Sensex did not create a consolidation zone on their way down in January 2011, it has left a clear path for prices to rise.
The major headwind to the price rise is the fact that the markets are so close to all-time highs and susceptible to a turn. Longs can, of course, stay long keeping in mind that the higher the market goes the greater is the possibility of a reversal. This is where stops help. We would ideally keep the stop of half the daily average true range (ATR) below the closest support level on a 60-minute chart. An average true range is the range a stock or index moves every day.
George Albert is Editor, www.capturetrends.com
 "Russian drones over Poland: Trump’s tepid reaction a wake-up call for Nato?")
 "As Russia pushes east, Ukraine faces mounting pressure to defend its heartland")
 "Why Mossad was not on board with Israel’s strike on Hamas in Qatar")
 "Turkey: Erdogan's police arrest opposition mayor Hasan Mutlu, dozens officials in corruption probe")


](https://images.firstpost.com/wp-content/uploads/2013/01/STOCKM.jpg)