
 "Can equity rally when copper is refusing to confirm it?")
By George Albert
Rallies in the equity markets have been led or supported by the copper market since the low of March 2009. But that has not been the case in the latest rally which began in September 2011. Based on what we know of the copper and equity market linkage, the current rally in stocks looks suspicious.
[caption id=“attachment_585604” align=“alignleft” width=“380”]  There is a reason why copper is given a lot of importance by the sages of equity markets. Reuters[/caption]
There is a reason why copper is given a lot of importance by the sages of equity markets. The metal is used in a lot of manufacturing processes. Hence if the economy and manufacturing are really growing so should the demand for copper. The logic goes that when manufacturers begin ramping up production they need more copper. This increases the price of copper and as equity market players see the prices of copper rise, they buy in to equity since that is the next asset class to begin rallying.
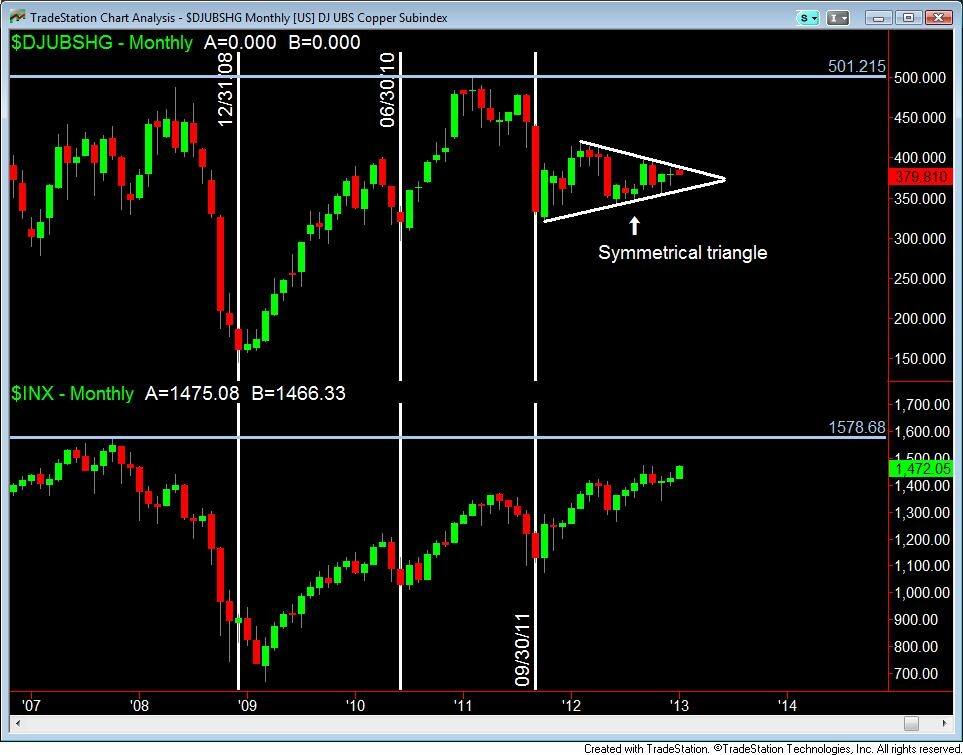
We need to mention that the markets do get smarter all the time. Earlier copper was a leading indicator and the metal rallied before the equity market. But of late that does not seem to be true as traders have caught on and are reacting faster to the signals copper gives. Let us look at the combined monthly chart of the copper index and the S&P 500 index. (Click here for the chart). In a monthly chart, one candlestick shows the price action of one month. The chart on the top shows the copper index and the one below is the S&P 500. The bottoms in copper are shown by the white vertical lines.
Notice that in December 2008 copper bottomed out, consolidated and began to rally. However the S&P 500 continued to fall for three more months before rallying in March 2009. The next bottom was in June 2010, after which copper began to rally again. By this time the equity market had grown smarter, as it did not continue to fall like the last time, but consolidated before rallying after three months.
Finally, the last bottom of the copper market was in September 2011. At this time both copper and the equity index began rallying together.
However, something different is happening now. The equity index continued to rally but copper went into a consolidation pattern called the symmetrical triangle. The rally has not only happened in the US equity markets, but in India too. This brings us to the question: can equity markets continue to rally when copper does not support it? It seems unlikely, given the history of copper and equities. But it’s possible that the indexes are now being driven by service sector stocks rather than manufacturing, which could complicate the equity index and copper link. But till we have data invalidating the proven copper-equity link, we’d treat the current rally with caution.
Symmetrical triangles are continuation patterns, which means that price continues out of the triangle in the direction it came in. Notice that copper fell after hitting an all-time high and then formed a symmetrical triangle. So, according to the textbooks, copper should break below the triangle and continue falling. But it is always best to await the break of the triangle before taking a position. It’s possible that the continuation pattern is invalidated and copper breaks above. In that case one can be bullish on both copper and equities.
Let us consider the scenarios that can play out and the actions one can take. One scenario is that copper breaks out lower, which could be bearish for the equity markets and one can short stocks. The second scenario can be that copper breaks higher, which is bullish. But in this scenario remember that equity markets are near all-time highs; so going long on stocks will not be a long term play unless equities are able to break to new highs. It is very likely that we could see a drop in equities from all-time highs, providing very little profit potential for longs. The all-time highs for copper and S&P 500 are marked by horizontal lines on the charts.
The third scenario could be that copper continues into the apex of the triangle, making any move after that weak. The textbooks say that the closer the price gets to the apex of the triangle, the weaker the break, if there is any. In that scenario, equity could consolidate too. There can be several other scenarios, but we will look into those if any crystallize.
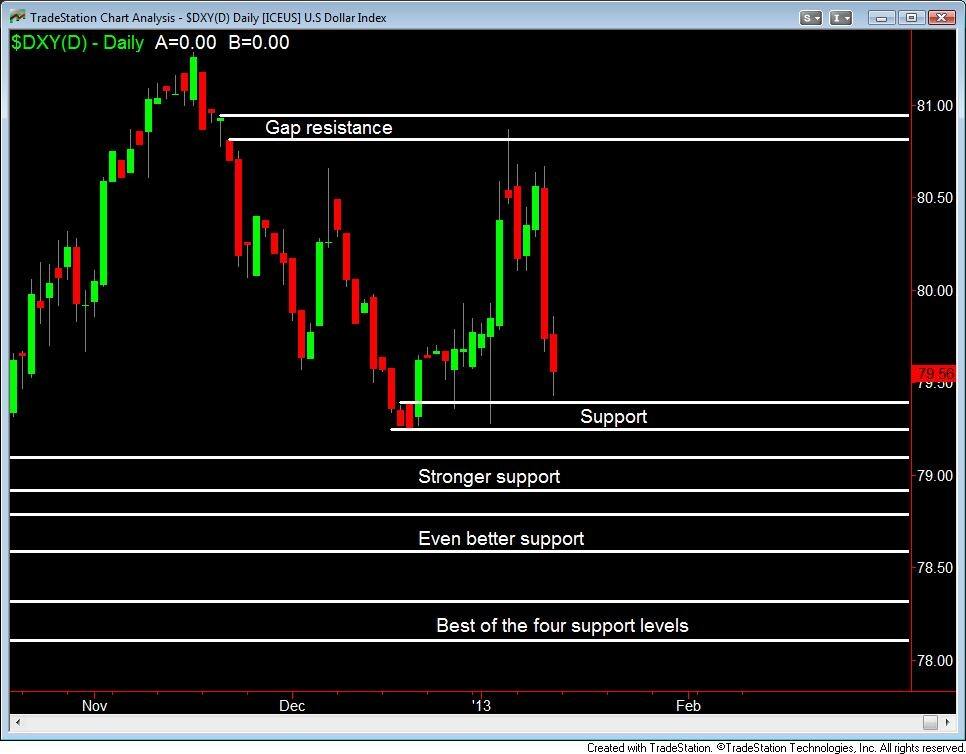
US dollar: This week the dollar index hit a gap resistance level and sold off strongly. Gaps are strong areas of support or resistance. We have spoken about the importance of gaps in earlier articles. Support levels are areas where demand for stocks far exceeds supply, leading to a rally in price. Resistance levels are areas where supply exceeds demand, leading to a fall in price. See chart here
The dollar is now near a level of support, which could lead to a bounce and below that are other stronger levels of support. A rally in the dollar often leads to a drop in equity prices.
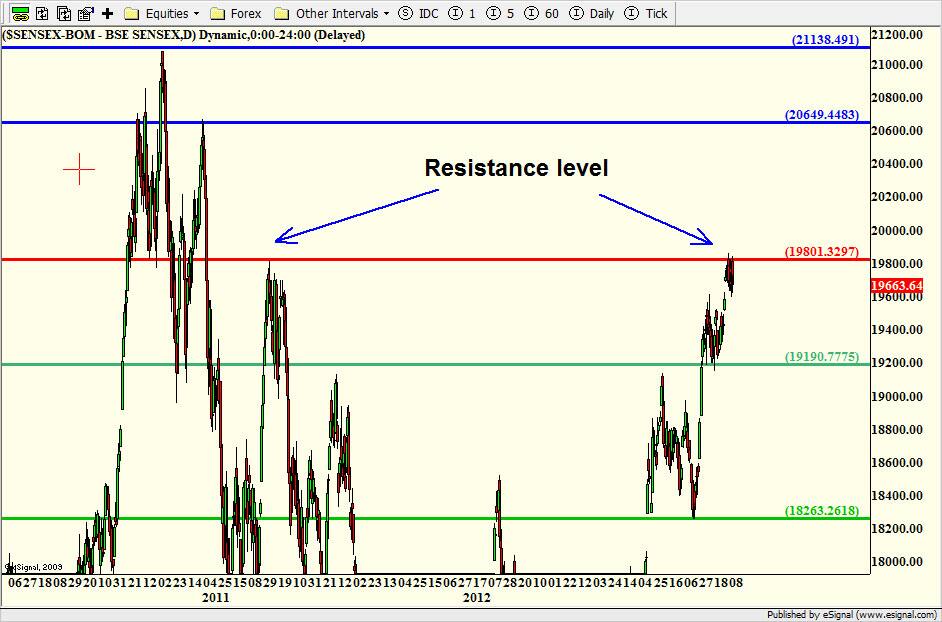
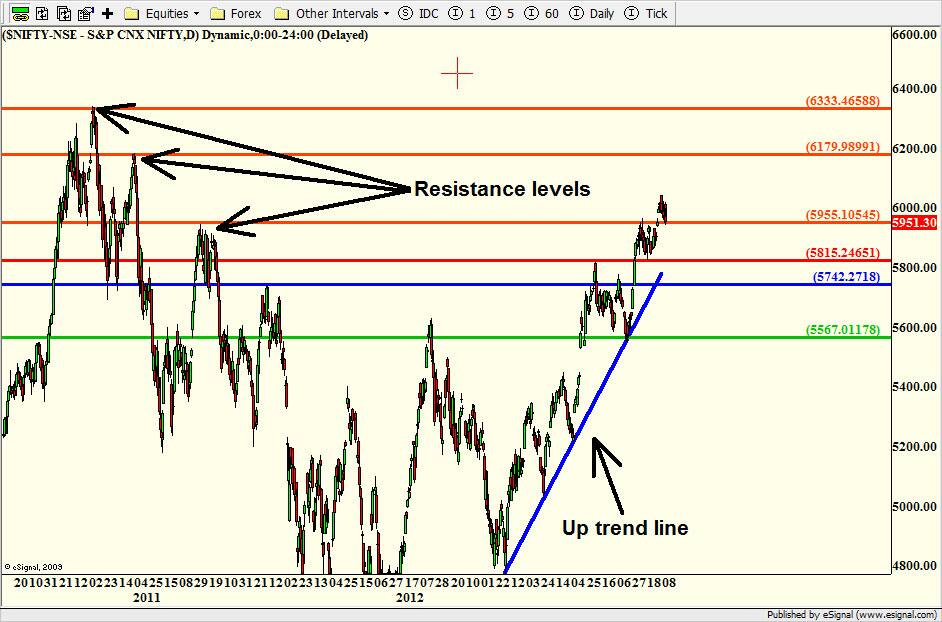
Sensex and Nifty: We had mentioned last week that even though the Nifty had broken out of resistance, a further rally was possible only if the Sensex broke above its resistance level. (Click here for the Sensex chart and here for the Nifty chart). Notice that the Sensex failed to break out higher and fell a bit. The Nifty, therefore, was not able to rally. The analysis on the Sensex and Nifty that we made last week is still valid.
George Albert is Editor, www.capturetrends.com
 "Russian drones over Poland: Trump’s tepid reaction a wake-up call for Nato?")
 "As Russia pushes east, Ukraine faces mounting pressure to defend its heartland")
 "Why Mossad was not on board with Israel’s strike on Hamas in Qatar")
 "Turkey: Erdogan's police arrest opposition mayor Hasan Mutlu, dozens officials in corruption probe")


](https://images.firstpost.com/wp-content/uploads/2013/01/NIFTY-REUTERS2.jpg)