
 "RTI reponse reveals over 18 lakh ration cards applications pending in UP; 56.8% requests rejected")
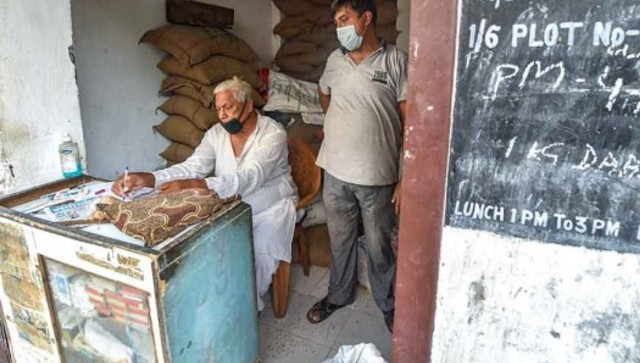
Lakhs of migrant workers who returned to their hometowns in Uttar Pradesh during the lockdown are eagerly waiting for their ration cards in order to avail subsidised food grains allocated under the Public Distribution System in this time of crisis under. An RTI reply has revealed the state has over 18 lakh ration card applications pending with a whopping 91.9 percent of them pending beyond the stipulated 30 days for approval. Uttar Pradesh has witnessed maximum number of migrant workers in the country with more than 31 lakhs having returned from other states during the lockdown, the state’s chief secretary had informed on 4 June, 2020. On 12 May, 2020, Uttar Pradesh chief minister Yogi Adityanath had given specific directions that those in need and eligible for subsideised ration should be provided with ration cards, including migrant workers. Between late March when the lockdown was announced in India and the month of May, the state has reportedly issued more than 5.8 lakh ration cards. Yet, 18,84,537 (or 10.2 percent) of the total applications for new ration cards are pending in the state. In all, the state received 1,85,57,659 applications under the State e-Governance Service Delivery Gateway (SSDG) system run by the Food and Civil Supplies Department of Uttar Pradesh. This information has been provided by the department in response to an RTI application filed by this author. While the response from the department does not mention the time period in which these applications were received, the date mentioned for the data compiled by the department is 31 July, 2020. The author has enquired from the department regarding the time period for the applications received and the details are awaited. As per the RTI response, out of the total pending applications, only 1,58,251 or 8.1 percent are pending within the stipulated time period of 30 days for application approval, while 17,31,686 (or a whopping 91.9 percent) are those pending beyond 30 days. Of the total 1.86 crore applications received, the department has accepted 61,29,525 applications (or 33 percent) while 1,05,43,597 (or 56.8 percent) applications have been rejected. [caption id=“attachment_8797151” align=“alignnone” width=“640”] Over 30 lakh migrant workers have returned to Uttar Pradesh during Lockdown. AP[/caption] The information released via RTI also gives a district-wise breakdown of the ration card applications as well. Out of total 75 districts in the state, the highest number of applications have been received in Sitapur district in Eastern Uttar Pradesh. The district also has the highest number of rejections. The least number of applicatios were received in Sonbhadra district in Western Uttar Pradesh. Sonbhadra also ranks lowest in terms of ration card applications approved, rejected as well as pending. Kanpur Nagar in central Uttar Pradesh has the highest number of applications awaiting approval. Among the four regions in Uttar Pradesh — Western, Eastern, Central and Bundelkhand — the highest average number of applications per district have been received in Central Uttar Pradesh while the least have been received in the Bundelkhand region. An analysis of the ration card applications processed by the Food and Civil Supplies Department as stated in the RTI response, revealed a strong positive correlation between the average gross domestic product (GDP) per district (as per the 2017-18 official data from Uttar Pradesh Directorate of Economics and Statistics) and the average number of applications received per district in each of the four regions.
Analysis of total applications shows that the more is the average GDP per district of a particular region, the more are the average number of applications received, betraying the logic that people in wealthier regions are less reliant on PDS.
However, an analysis of the total existing ration card holders in the four regions paints the opposite picture. There is a fairly strong negative correlation between the region-wise average GDP per district and the average existing ration card holders per district, respectively. What this means is that the more is the average GDP per district of the region, the lesser is the average number of ration card holders per district in each region. Table 1: Region-wise Ration Card Statistics
| Regions | Number of Applications Received | Average Gross Net Product per District (Crores) | Average Ration Cards per District |
|---|---|---|---|
| Bundelkhand | 118317.4 | 8898.393 | 473909.9 |
| Central UP | 368249.2 | 22130.62 | 363557.7 |
| Eastern UP | 237428.3 | 12363.66 | 504035.3 |
| Western UP | 250992.4 | 22034.79 | 485337.2 |
| Source: UP Directorate of Economics and Statistics (for economic data); Food and Civil Supplies Department (for ration card data, accessed on 4 September 2020); RTI response (ration card applications) |
As of 4 September, the total number of ration cards in the state stood at more than 3.58 crores with more than 3.17 crores priority households, which include both the Below Poverty Line (BPL) and Above Poverty Line (APL) households as per the National Food Security Act 2013 (NFSA). At the same time, there are more than 40.77 Antyodaya ration card holders in the state. On average, the highest number of average ration cards per district is found in the Eastern UP region followed by Western UP, Bundelkhand and Central UP. Table 2: Bundelkhand Region Ration Card Statistics and Economic Performance
| District | Total Applications | Accepted applications | Rejected Applications | Pending applications within time limit (30 days) | Pending applications outside time limit (30 days) | Total Pending Applications | Gross Net Product (Crores) | Per Capita Net Product | Total Ration Card Holders |
|---|---|---|---|---|---|---|---|---|---|
| Chitrakoot | 145623 | 35650 | 98060 | 684 | 11229 | 11913 | 6477.23 | 56402 | 443449 |
| Banda | 210741 | 42474 | 160492 | 797 | 6978 | 7775 | 7083.05 | 36320 | 199569 |
| Mahoba | 50560 | 22670 | 17596 | 1270 | 9024 | 10294 | 8763.35 | 89035 | 421760 |
| Hamirpur | 92166 | 56639 | 27309 | 1054 | 7164 | 8218 | 6507.16 | 58109 | 633554 |
| Jalaun | 89609 | 51992 | 21778 | 1938 | 13901 | 15839 | 10293.76 | 56473 | 583545 |
| Jhansi | 126494 | 82794 | 31200 | 2408 | 10092 | 12500 | 15551.24 | 72827 | 798358 |
| Lalitpur | 113029 | 63548 | 26323 | 1151 | 22007 | 23158 | 7612.96 | 55083 | 237134 |
| Total | 828222 | 355767 | 382758 | 9302 | 80395 | 89697 | 62288.75 | 3317369 | |
| Average per district | 118317.4 | 50823.86 | 54679.71 | 1328.857 | 11485 | 12813.86 | 8898.393 | 60607 | 473909.9 |
| Source: UP Directorate of Economics and Statistics (for economic data); Food and Civil Supplies Department (for ration card data, accessed on 4 September 2020); RTI response (ration card applications) |
Table 3: Central UP Ration Card Statistics and Economic Performance
| District | Total Applications | Accepted applications | Rejected Applications | Pending applications within time limit (30 days) | Pending applications outside time limit (30 days) | Total Pending Applications | Gross Net Product (Crores) | Per Capita Net Product | Total Ration Card Holders |
|---|---|---|---|---|---|---|---|---|---|
| Kanpur Dehat | 138099 | 67995 | 55169 | 1418 | 13517 | 14935 | 9992.79 | 51963 | 352372 |
| Kanpur Nagar | 399043 | 241537 | 71924 | 4329 | 81253 | 85582 | 39243.42 | 82378 | 199280 |
| Fatehpur | 338881 | 63955 | 253922 | 1743 | 19261 | 21004 | 13064.19 | 46574 | 334809 |
| Unnav | 250278 | 111400 | 105391 | 4904 | 28583 | 33487 | 17038.46 | 51135 | 584509 |
| Khiri | 431264 | 121447 | 258333 | 994 | 50490 | 51484 | 21974.19 | 48188 | 388536 |
| RaiBareily | 98583 | 41579 | 38463 | 1259 | 17282 | 18541 | 12213.68 | 34227 | 316428 |
| Lucknow | 304911 | 182753 | 79672 | 5211 | 37275 | 42486 | 47943.97 | 91901 | 311991 |
| Sitapur | 926675 | 189914 | 672153 | 1787 | 62821 | 64608 | 20644.46 | 40924 | 564195 |
| Hardoi | 426509 | 166995 | 230612 | 2717 | 26185 | 28902 | 17060.45 | 37745 | 219899 |
| Total | 3314243 | 1187575 | 1765639 | 24362 | 336667 | 361029 | 199175.6 | 3272019 | |
| Average per district | 368249.2 | 131952.8 | 196182.1 | 2706.889 | 37407.44 | 40114.33 | 22130.62 | 53892.78 | 363557.7 |
| Source: UP Directorate of Economics and Statistics (for economic data); Food and Civil Supplies Department (for ration card data, accessed on 4 September 2020); RTI response (ration card applications) |
Table 4: Eastern UP Ration Card Statistics and Economic Performance
| District | Total Applications | Accepted applications | Rejected Applications | Pending applications within time limit (30 days) | Pending applications outside time limit (30 days) | Total Pending Applications | Gross Net Product (Crores) | Per Capita Net Product | Total Ration Card Holders |
|---|---|---|---|---|---|---|---|---|---|
| Amethi | 45239 | 3201 | 40265 | 312 | 1461 | 1773 | 8405.59 | 47791 | 714539 |
| Ambedkar Nagar | 345454 | 82294 | 245951 | 1507 | 15702 | 17209 | 8667.29 | 33117 | 664287 |
| Ayodhya | 461237 | 94886 | 346208 | 3745 | 16398 | 20143 | 11674.8 | 43292 | 399409 |
| Barabanki | 374051 | 77204 | 267252 | 1447 | 28148 | 29595 | 15845.34 | 43640 | 356374 |
| Sultanpur | 77255 | 9429 | 58214 | 978 | 8634 | 9612 | 11197.4 | 42920 | 334067 |
| Azamgarh | 550836 | 199447 | 303362 | 2416 | 45611 | 48027 | 16918.81 | 33823 | 643064 |
| Baliya | 227976 | 128000 | 66157 | 2733 | 31086 | 33819 | 10352.98 | 29441 | 795230 |
| Mau | 291107 | 82601 | 185468 | 1674 | 21364 | 23038 | 9152.81 | 37872 | 436367 |
| Kushinagar | 96070 | 2985 | 90872 | 292 | 1921 | 2213 | 13730.77 | 34363 | 306180 |
| Gorakhpur | 90124 | 25864 | 31326 | 5052 | 27882 | 32934 | 21888.68 | 45283 | 296090 |
| Devariya | 506337 | 130495 | 339976 | 1953 | 33913 | 35866 | 11180.53 | 33789 | 346098 |
| Maharaj Ganj | 65309 | 2317 | 60309 | 463 | 2220 | 2683 | 10602.76 | 35175 | 498254 |
| Gonda | 335538 | 77496 | 221410 | 3139 | 33493 | 36632 | 13616.57 | 35193 | 222125 |
| Balrampur | 121052 | 18650 | 93216 | 1240 | 7946 | 9186 | 6904.98 | 27996 | 781150 |
| Bahraich | 238891 | 32324 | 197880 | 1186 | 7501 | 8687 | 12722.93 | 29038 | 289100 |
| Shravasti | 135060 | 39778 | 87468 | 507 | 7307 | 7814 | 3546.51 | 33604 | 291100 |
| Kaushambi | 171058 | 42913 | 110708 | 700 | 16737 | 17437 | 6909.95 | 38434 | 798639 |
| Pratapgarh | 694516 | 203440 | 450013 | 1887 | 39176 | 41063 | 10087.14 | 28929 | 381160 |
| Prayagraj | 910340 | 345520 | 495097 | 4645 | 65078 | 69723 | 41853.98 | 63582 | 315716 |
| Basti | 125577 | 34505 | 74809 | 2145 | 14118 | 16263 | 11089.03 | 41248 | 715567 |
| Sant Kabir Nagar | 86603 | 10360 | 69983 | 1608 | 4652 | 6260 | 5013.67 | 26421 | 268593 |
| Siddharth Nagar | 144992 | 23308 | 104371 | 2431 | 14882 | 17313 | 8693.35 | 29943 | 769219 |
| Mirzapur | 34406 | 5160 | 16331 | 955 | 11960 | 12915 | 12313.96 | 45260 | 1047308 |
| Sant Ravidas Nagar (Bhadoi) | 86166 | 14919 | 54471 | 1474 | 15302 | 16776 | 7687.05 | 45059 | 557344 |
| Sonbhadra | 12053 | 490 | 10918 | 45 | 600 | 645 | 13385.96 | 62757 | 415864 |
| Ghazipur | 211868 | 48773 | 142142 | 2131 | 18822 | 20953 | 12529.08 | 31555 | 206482 |
| Chandauli | 57627 | 15043 | 31519 | 1205 | 9860 | 11065 | 7333.4 | 34307 | 460611 |
| Jaunpur | 337488 | 14914 | 298828 | 3194 | 20552 | 23746 | 15243.93 | 31682 | 903771 |
| Varanasi | 51191 | 3050 | 40476 | 1550 | 6115 | 7665 | 19996.85 | 50153 | 403315 |
| Total | 6885421 | 1769366 | 4535000 | 52614 | 528441 | 581055 | 358546.1 | 14617023 | |
| Average per District | 237428.3 | 61012.62 | 156379.3 | 1814.276 | 18222.1 | 20036.38 | 12363.66 | 38471.28 | 504035.3 |
| Source: UP Directorate of Economics and Statistics (for economic data); Food and Civil Supplies Department (for ration card data, accessed on 4 September 2020); RTI response (ration card applications) |
Table 5: Western UP Ration Card Statistics and Economic Performance
| District | Total Applications | Accepted applications | Rejected Applications | Pending applications within time limit (30 days) | Pending applications outside time limit (30 days) | Total Pending Applications | Gross Net Product (Crores) | Per Capita Net Product | Total Ration Card Holders |
|---|---|---|---|---|---|---|---|---|---|
| Aligarh | 365112 | 172698 | 154595 | 4079 | 33740 | 37819 | 23305.32 | 56717 | 259229 |
| Etah | 148444 | 53213 | 77675 | 1820 | 15736 | 17556 | 10822.26 | 83490 | 431559 |
| Kasganj | 142641 | 45786 | 77086 | 1680 | 18089 | 19769 | 11323 | 72766 | 788018 |
| Hathras | 115316 | 53492 | 44547 | 790 | 16487 | 17277 | 10132.11 | 59725 | 204570 |
| Agra | 427559 | 133568 | 224309 | 4761 | 64921 | 69682 | 45605.77 | 92640 | 698931 |
| Firozabad | 305050 | 107810 | 165427 | 1218 | 30595 | 31813 | 14832.87 | 53401 | 592407 |
| Mathura | 99906 | 60360 | 29125 | 2530 | 7891 | 10421 | 16595.62 | 58251 | 335848 |
| Mainpuri | 204037 | 97310 | 79163 | 1548 | 26016 | 27564 | 8939.31 | 44149 | 364692 |
| Etawah | 233539 | 97894 | 119388 | 2677 | 13580 | 16257 | 9772.89 | 56657 | 618970 |
| Auraiya | 211271 | 61771 | 134130 | 1495 | 13875 | 15370 | 6759.41 | 45244 | 511195 |
| Kannauj | 263445 | 98035 | 145640 | 1081 | 18689 | 19770 | 12089.62 | 66506 | 593468 |
| Farukkhabad | 238963 | 116123 | 105713 | 1284 | 15843 | 17127 | 9659.6 | 46497 | 568433 |
| Pilibhit | 258909 | 57057 | 176907 | 1316 | 23629 | 24945 | 14143.05 | 62038 | 757539 |
| Badayun | 316384 | 103747 | 181072 | 3179 | 28386 | 31565 | 17590.36 | 43375 | 251553 |
| Bareily | 723247 | 166608 | 478728 | 3601 | 74310 | 77911 | 37186.71 | 74683 | 303296 |
| Shajahanpur | 509708 | 160376 | 314952 | 3849 | 30531 | 34380 | 17451.72 | 53272 | 847013 |
| Ghaziabad | 232295 | 124949 | 63293 | 3765 | 40288 | 44053 | 35386.02 | 81856 | 182287 |
| Gautam Buddh Nagar | 88869 | 52949 | 20630 | 1771 | 13519 | 15290 | 118055.8 | 595551 | 497649 |
| Bulandshahar | 117124 | 51632 | 43566 | 2359 | 19567 | 21926 | 28360.9 | 73520 | 310278 |
| Baghpat | 67678 | 43232 | 16832 | 1231 | 6383 | 7614 | 10429.3 | 76048 | 462169 |
| Meerut | 375324 | 221854 | 108086 | 5135 | 40249 | 45384 | 41694.88 | 113091 | 379781 |
| Hapur | 29999 | 12640 | 11307 | 826 | 5226 | 6052 | 11781.82 | 80574 | 495408 |
| Amroha | 234064 | 91400 | 119399 | 717 | 22548 | 23265 | 17935.57 | 87153 | 456104 |
| Bijnaur | 372465 | 130631 | 201629 | 2699 | 37506 | 40205 | 26204.39 | 65451 | 556702 |
| Moradabad | 353322 | 114219 | 202332 | 1212 | 35559 | 36771 | 21849.74 | 61705 | 501165 |
| Rampur | 86331 | 28225 | 31447 | 604 | 26055 | 26659 | 17952.19 | 69222 | 378520 |
| Sambhal | 124586 | 59841 | 36388 | 1543 | 26814 | 28357 | 10673.2 | 43427 | 584125 |
| Muzzafarnagar | 350158 | 140842 | 176315 | 2734 | 30267 | 33001 | 21530.03 | 69219 | 440017 |
| Shamli | 197124 | 63109 | 120719 | 1865 | 11431 | 13296 | 8864.83 | 64864 | 593340 |
| Saharanpur | 336903 | 95446 | 199800 | 3204 | 38453 | 41657 | 24115.35 | 63264 | 595851 |
| Total | 7529773 | 2816817 | 3860200 | 66573 | 786183 | 852756 | 661043.6 | 14560117 | |
| Average per District | 250992.4 | 93893.9 | 128673.3 | 2219.1 | 26206.1 | 28425.2 | 22034.79 | 83811.87 | 485337.2 |
| Source: UP Directorate of Economics and Statistics (for economic data); Food and Civil Supplies Department (for ration card data, accessed on 4 September 2020); RTI response (ration card applications) |
Surprisingly, Bundelkhand, despite having the lowest average per district GDP, has received the lowest number of average applications for new ration cards per district. It should be noted that the region is widely perceived as underdeveloped and suffering from large scale hunger. In fact, Bundelkhand is the only region with a strong negative correlation between the per capita income of districts and the number of applications, ie, the more is the per capita income the lesser is the number of applications received in the districts of the region. Incidentally, Bundelkhand has had more per capita availability of food grains than the state average as observed between years 1997 and 2006 in the 2009 study on the region by AK Singh, A Joshi and Nomita P Kumar from the Giri Institute of Development Studies.
Central Uttar Pradesh which includes important administrative and business districts such as Lucknow and Kanpur, though with the lowest average number of ration card holders per district in the state, has received maximum average number of applications per district.
A large backlog of pending applications and the return of more than 30 lakh migrant workers is a worrying combination. Moreover, the pending applications also include those received before the current crisis. The introduction of new ration cards in the state in 2016 replacing the old ones had left many erstwhile ration card holders without one. These ration cards are also a prerequisite for availing benefits for many other schemes such as Ujjwala Gas Yojana (scheme). While the lockdown has spelled disaster for returning migrant workers, those eligible for ration cards who were already living here and have been hit hard by the suspension of economic activity also urgently need them. With slow resumption of economic activity many of the applicants, especially those belonging to the unorganised sector require immediate relief in form of ration allocated under the NFSA.

 "Charlie Kirk, shot dead in Utah, once said gun deaths are 'worth it' to save Second Amendment")
 "From governance to tourism, how Gen-Z protests have damaged Nepal")
 "Did Russia deliberately send drones into Poland’s airspace?")
 "Netanyahu ‘killed any hope’ for Israeli hostages: Qatar PM after Doha strike")


