
 "Gold is in pause mode: 2012 may not see decisive moves")
The long term rally in gold may be in for a substantial period of consolidation if past price action of the precious metal is anything to go by. Based on the chart, gold can continue to consolidate for more than a year.
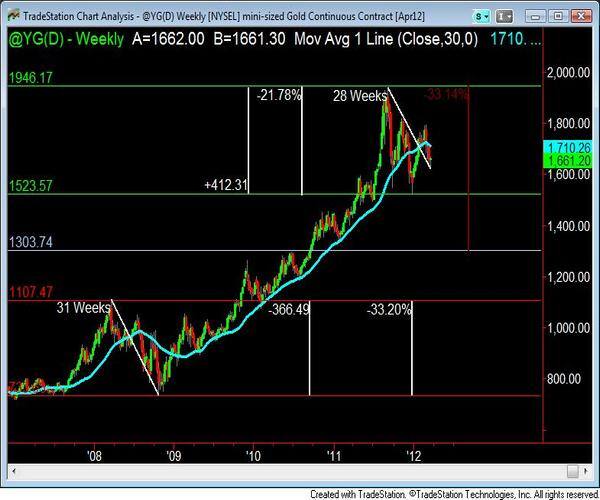
The last time gold had a major correction was in 2008 after it hit an all time high of $1100. (Click here for the gold chart) Prices then fell for nearly 31 weeks by as much as 33 percent. The fall began in March 2008 and continued till October 2008. Gold only made a new high in November 2009, over 82 weeks after its previous high. In dollar terms the price of gold fell by $366 in the year 2008.
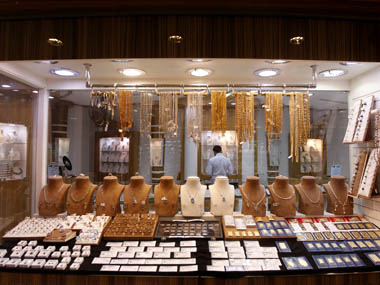
[caption id=“attachment_254287” align=“alignleft” width=“380” caption=“Reuters”]  [/caption]
This time around gold peaked near $1950 in September 2011 and fell nearly 22 percent by December 2011 to nearly $1525 before bouncing once again. Gold is just 28 weeks into its corrective phase and if the precious metal repeats its previous price behavior there are still 54 weeks before we see a break out to a new high. That’s slightly more than a year.
Let us look at the chart to see the price action of gold. The drop in 2008 is demarcated by the two red horizontal lines and the current drop is contained between the two green lines. The sloping white lines between the red lines show the time taken complete the fall which was 31 weeks. The sloping white line between the green ones shows that the current fall is only 28 weeks old and can go down further.
The white vertical lines show fall in dollar and percentage terms. Notice that the current fall in dollar terms has exceeded fall of 2008, but not in percentage terms. If gold fell 33 percent now like it did in 2008 prices would hit $1300, which is shown by the grey horizontal line and the red vertical line. However, if one takes the time factor of the 31-week downtrend, it seems unlikely that gold will fall so much in three weeks. But remember the initial fall in September 2011 took gold down by 20 percent in four weeks, so anything is possible.
However, one should not ignore the 30-week moving average shown by the blue sloping line. A moving average is the average closing price over a specified period of time. The 30-week is used by long term investors see if the prices are bearish or bullish. When the average is sloping down and prices are below it the market is considered bearish and vice versa.
Notice that the price of gold is below the 30-week average and the average is sloping down, which makes gold bearish now. Notice that in 2008 gold stayed below the average for quite sometime before rallying and that could happen again. However, gold did not stay bearish in 2008 and let’s see what it does this time around.
The gold market is getting mixed fundamental signals. Europe and US are still in an easy money mode, which is bullish for gold. However, the big consumers of gold such as India and China are tight on money which is bearish. The US bond markets are suggesting higher interest rates as US-Treasury prices are falling, which again gives mixed signals. If rates are rising because the market sees growth that may be a negative for gold, but if inflation is the trigger it’s positive for gold.
Given these confusing factors how does one trade gold. The answer is simple. Move from a long term bullish investment bias to a medium term neutral trading bias. So buy low and sell high in the ranges as they form. Based on the most recent range one could sell or short gold at $1800 or even at its 30-week moving average which was $1710 on Friday’s close. The average moves as prices move. One can go long on the metal at $1525 range and below that at the $1400 level.
 "Israel targets top Hamas leaders in Doha; Qatar, Iran condemn strike as violation of sovereignty")
 "Nepal: Oli to continue until new PM is sworn in, nation on edge as all branches of govt torched")
 "Who is CP Radhakrishnan, India's next vice-president?")
 "Israel informed US ahead of strikes on Hamas leaders in Doha, says White House")


](https://images.firstpost.com/wp-content/uploads/2012/03/Gold_Reuters_38011.jpg)