
 "Dollar shakes off bear hold; gives bullish signal")
The US dollar, written off by several experts in the market, has staged a turnaround and shaken off the bear hold at least for the medium term. Even the long term picture does not look good for greenback bears.
There was a lot of discussion about a double dip recession and high employment in the US which was supposed to push the greenback down. Market players were also keen on buying the Canadian and Australian dollar which were rallying against the US dollar. However, the greenback confounded its bears to rally and give a bullish signal.
[caption id=“attachment_102207” align=“alignleft” width=“380” caption=“Even though the dollar index has turned bullish, now is not the time to go long on the greenback. Getty Images”]  [/caption]
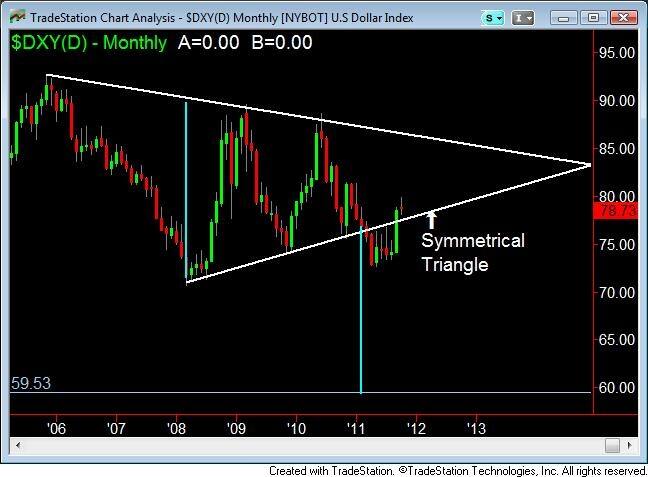
In previous articles we had mentioned that the dollar index, which measures the greenback against a basket of six major currencies, gave a bearish signal on the long term charts. Based on the signal the dollar index should have fallen to 60 in the near future, but had to fall below a strong support area of 70 first. The index closed at 78.73 last Friday after failing to break below the 70 mark for over five months.
The bearish prediction was based on fact that dollar index formed a chart pattern called the symmetrical triangle. ( See chart ). In a symmetrical triangle prices move in a continuously narrowing range. Once prices break either above or below the symmetrical the prices makes the measured move. The measured move is arrived at finding the distance between the second touch in the triangle and the border on the opposite side.
In the case of the dollar index the measured move failed as the index broke down but rallied back into the triangle. Once prices are thrown back into the symmetrical triangle the bearish forecast is invalidated. It does not mean that the bearish bias is invalid on the long term charts. However, a look at the medium term charts show that the dollar index has turned bullish.
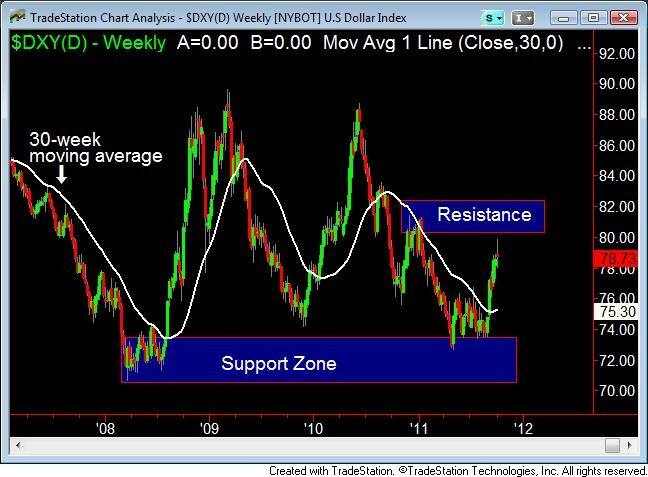
To get a sense of the medium term trend, we are looking at a 30-week simple moving average. Several investors use the theory of the four stages of the market, combined with the 30-week moving average to get a long term picture of the market. ( See chart ). However, since the dollar index has been moving above and below the average frequently, one cannot get a long term perspective. Only when the prices stay above or below the moving average for a long time does it act as a signal for the long term trend of the market. A long term trend usually lasts for nearly four years.
When using the four stages of the market with the 30-week moving average, the bias turns from bearish to bullish when the following factors are met. First prices must fall and go sideways. Notice that the dollar index went side ways near the blue box at the bottom of the chart for a few months. The prices must break out of the consolidation area and move above the 30-week average (shown by the white line on the chart), which the dollar index has done. Finally, the moving average must turn up, which has also happened. Investors now wait for prices to fall back to the moving average before going long.
It is possible for the dollar index to rally all the way up the 90 level, but it has a few areas to clear. The first area to clear is shown by the blue box marked as resistance on the chart. Then it has to clear the 84 level.
Finally even though the dollar index has turned bullish, now is not the time to go long on the greenback. First, it’s close to the resistance level, from where prices can drop. Second, it’s best to wait for prices to fall close to the 30-week moving average before buying.
 "Israel targets top Hamas leaders in Doha; Qatar, Iran condemn strike as violation of sovereignty")
 "Nepal: Oli to continue until new PM is sworn in, nation on edge as all branches of govt torched")
 "Who is CP Radhakrishnan, India's next vice-president?")
 "Israel informed US ahead of strikes on Hamas leaders in Doha, says White House")


](https://images.firstpost.com/wp-content/uploads/2011/10/dollar-getty1.jpg)