
 "Bulls, watch out. Sensex level shows this isn't time to buy")
The equity markets in India, China, US and Japan have rallied close to key reversal areas, putting bulls on notice and waking the napping bear.
There is a bad scenario, and a terrible one, moving the global equity markets since July this year. The bad scenario is that the world economy may go into a double-dip recession. The terrible scenario envisions a eurozone default leading to a market crash.
Fear of the double-dip recession has been applying a downward pressure for quite some time. Fear of a default in Europe, on the other hand, has caused sharp drops in the market and sharp rallies whenever the scare seems to ebb.
[caption id=“attachment_108522” align=“alignleft” width=“380” caption=“It’s time for bulls to book profits on long positions and bears to initiate short positions.AFP”]  [/caption]
However, as the fear and euphoria play out, the market has not got a clear direction since August. Prices have been moving in a range and on Friday it reached the top end of that range, which can bring bears out with a vengeance.
Since global equity markets in India, China, Japan and the US are at the top end of the range, it’s time for bulls to book profits on long positions and bears to initiate short positions.
At the very least now is not the time to buy. Even if prices rise above the top end of the range-bound markets, there are strong resistance areas a little above. Prices often turn lower from resistance areas.
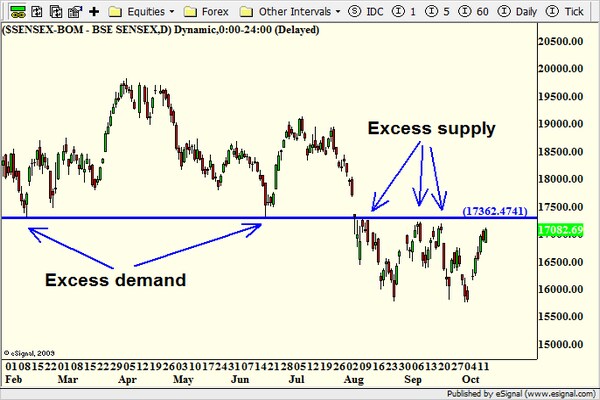
Indian markets: The Bombay Stock Exchange Sensex is nearing the top of its recent trading range of 17,300. This is an area where supply of stocks exceeded the demand for stock, resulting in a fall in the markets three times.
Notice the level on the Sensex chart ( view chart ) marked by the blue horizontal line. The market rallied from that level twice, once in February 2011 and then again in June as it was an area where demand exceeded supply.
Finally in August 2011, the market broke through that level to reach new lows for the year. Once prices fall below a level of demand it turns into supply. The Sensex chart proves it.
The reason for the phenomenon is simple. At any demand level, some investors buy stocks. If prices fall below that level, they want to sell at break even and hence a rally back to previous demand levels results in people getting out of the market.
Now that the Sensex is coming back to that level it does not make sense to buy.
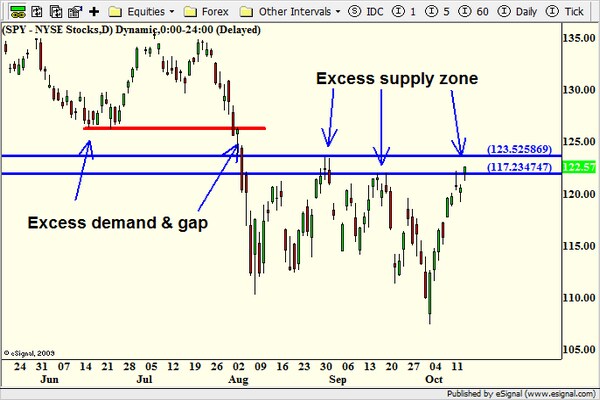
US markets: The S&P 500, which is an index followed around the globe, isalso reaching an area where supply exceeds demand. Let’s look at the SPY chart ( **view chart** ). SPY is the exchange-traded fund that tracks the S&P 500 index.
The range between $117 and $123.50 (which corresponds with 1,170 and 1,235 on the S&P 500 index) has been the top of the range for the SPY in the recent range-bound market. The range is shown by two blue horizontal lines. The close on Friday was $122.57.
Unlike the Sensex, the supply level on the SPY was not a previous area of demand. However, if the SPY rallies above the supply zone, it runs into another level, which was demand earlier. It is marked by the red line on the chart. This level can turn prices lower if the first supply zone fails.
Also note that there is a gap above the current supply zone, which is an area of extreme supply. A gap occurs in the market when prices close at a certain level on one day and opens much higher or lower the next.
When prices open lower, as in the case of SPY, it shows an absence of buyers due to which sellers had to lower prices substantially to get buying interest.
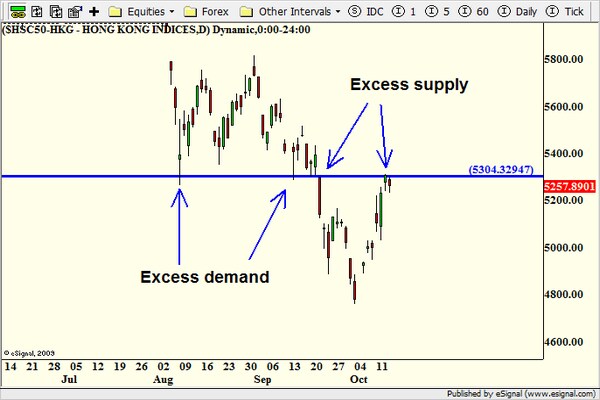
Chinese and Japanese markets: A look at the Chinese and Japanese markets also shows similar scenarios. The Hang Seng China 50 Index ( **view chart** ) looks a lot like the Sensex. The index is at a level of excess supply, which was earlier an area where demand exceeded supply of stocks. The excess supply level is shown by a blue horizontal line.
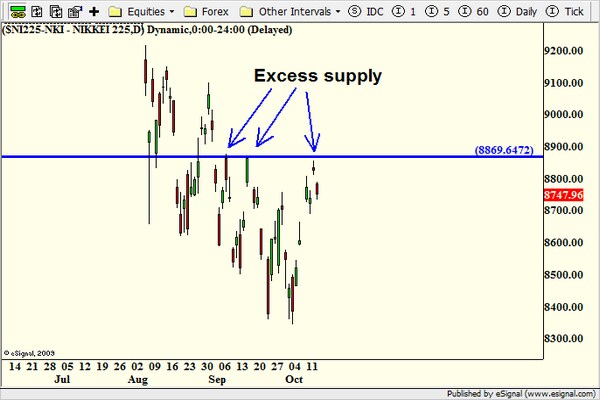
The Nikkei 225 chart ( view chart ), on the other hand, looks like the S&P 500. In case the Nikkei breaks the supply level shown by the blue horizontal line, it has a gap above just like the S&P 500. This gives very little upside for bulls.
Trading approach: At any given time in the market one can do three things - buy, sell/short or not trade at all. Buying at a level where prices have turned lower earlier makes no sense. One could sell to book some profits or even go short. If not trading is your option, then may be you should be an analyst.
The bear could possibly be wrong, in which case one could get out with a small loss. However, the potential profit, if the market drops to its most recent lows, is huge. And that’s what the markets have been doing recently - down, up, down, up in a range.
George Albert is Editor at www.capturetrends.com
 "Israel targets top Hamas leaders in Doha; Qatar, Iran condemn strike as violation of sovereignty")
 "Nepal: Oli to continue until new PM is sworn in, nation on edge as all branches of govt torched")
 "Who is CP Radhakrishnan, India's next vice-president?")
 "Israel informed US ahead of strikes on Hamas leaders in Doha, says White House")


](https://images.firstpost.com/wp-content/uploads/2011/10/stocks-afp.jpg)