29 days and 44 matches in to the tournament and some definite patterns have started to emerge in the Indian Premier League 2013. Chennai Super Kings and Royal Challengers Bangalore are on top of the ladder with some scintillating batting performances, whereas Rajasthan Royals and Sunrisers Hyderabad find a place in top five thanks to their strong bowling attacks. [caption id=“attachment_746247” align=“alignleft” width=“380”]
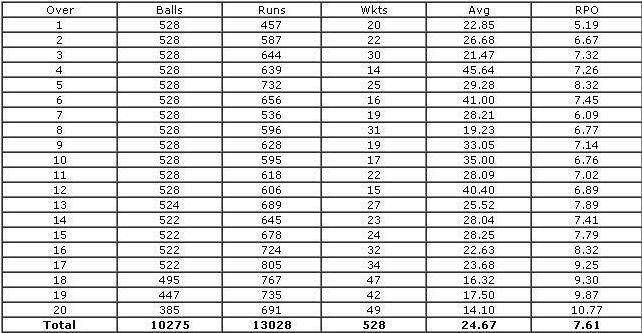
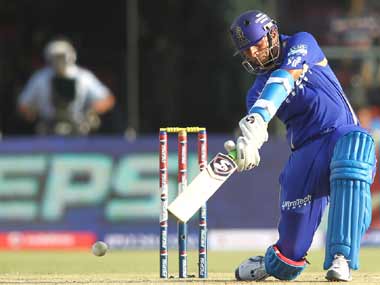 Dravid is one of the successful seniors of this year’s IPL. BCCI[/caption] The statistical tables in this feature will show how the nine teams have performed with bat and ball in the tournament. Chennai Super Kings have the best batting average, whereas Royal Challengers Bangalore have the best run-rate. On the bowling front, Rajasthan Royals have the best bowling average, while Sunrisers Hyderabad have the best economy. Pune Warriors India are at the bottom in both the tables. Below are comprehensive stats updated till the Chennai Super Kings vs Kings XI Punjab match on 2 May. Distribution of balls faced and runs scored
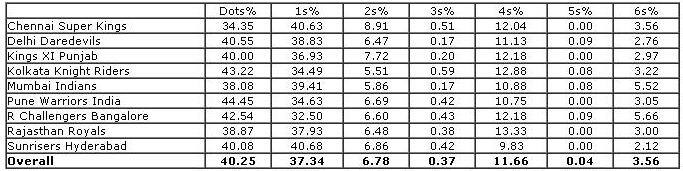 Distribution of runs scored in different phases of game
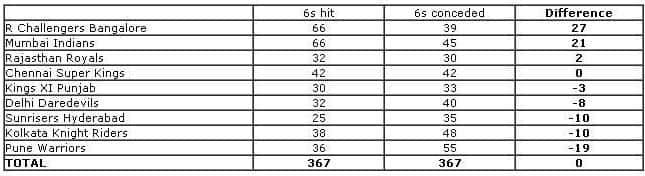
 Tournament sixes
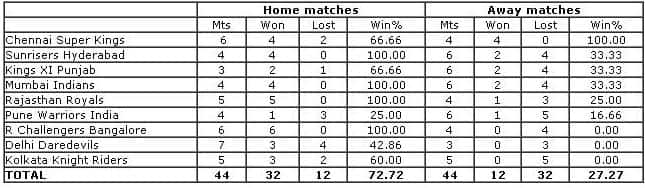
 Teams performances at home and away in IPL6
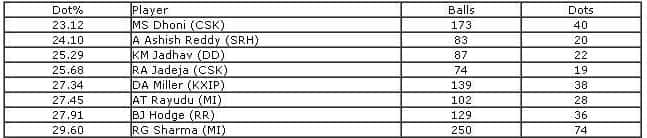
 Batsmen facing lowest % of dot balls (Min.50 balls faced)
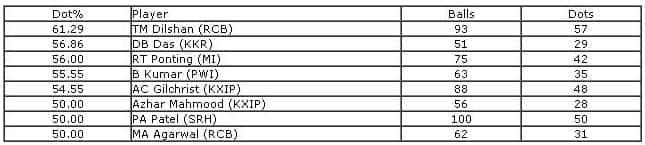
 Batsmen facing highest % of dot balls (Min.50 balls faced)
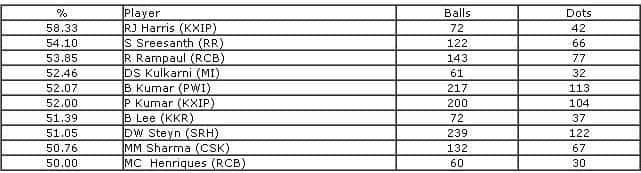
 Bowlers delivering high % of dot balls (Min.8 overs)
 Bowlers delivering low % of dot balls (Min.8 overs)
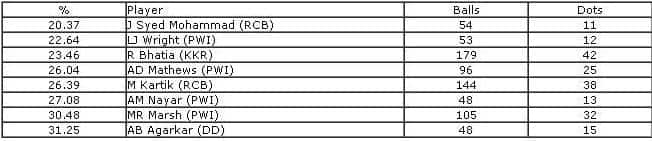
IPL Stats: The patterns that are emerging
Rajneesh Gupta
• May 2, 2013, 18:02:55 IST
29 days and 44 matches in to the tournament and some definite patterns have started to emerge in the Indian Premier League 2013. Here are some stats that will help you identify them.
Advertisement
 "IPL Stats: The patterns that are emerging")
End of Article