
 "Can Trump do a Truman? When opinion polls err and media is biased")
Harry S Truman had the last laugh—literally.
In the most memorable and iconic photo in American presidential elections, a broadly grinning “Give ‘Em Hell Harry” was seen holding a copy of the Chicago Daily Tribune with the front-page erroneous banner headline “DEWEY DEFEATS TRUMAN” at St Louis Union Station, Missouri, on November 3, 1948.
Truman celebrates comeback victory & Chicago Tribune’s mistake, today 1948: #NARA pic.twitter.com/pHkcOGXEmu
— Michael Beschloss (@BeschlossDC) November 3, 2016
The photo was clicked the day after the presidential election with Democrat incumbent Truman defeating his Republican challenger and New York governor Thomas E Dewey.
Harry gave opinion polls Hell indeed.
Opinion polls had sealed Truman’s defeat on Election Day. In August/September, Gallup poll, famous for accurately predicting presidential election results, showed Dewey leading Truman by 48-46 per cent to 37-40 per cent and 50 to 45 per cent in October.
With a looming deadline and the absence of results on November 2, the Tribune assumed that Dewey would clobber Truman.
However, defying opinion polls and the media frenzy, Truman made a stunning comeback to win a second term. He won 49.55 per cent of the popular vote and Dewey 45.07 per cent. Gallup had underestimated Truman’s percentage of the popular vote by +4.55 per cent.
Impact Shorts
More ShortsHarris’ ‘honeymoon’ period?
Seventy-six years later, opinion polls and the American media have gone into a similar overdrive around two months before the presidential election.
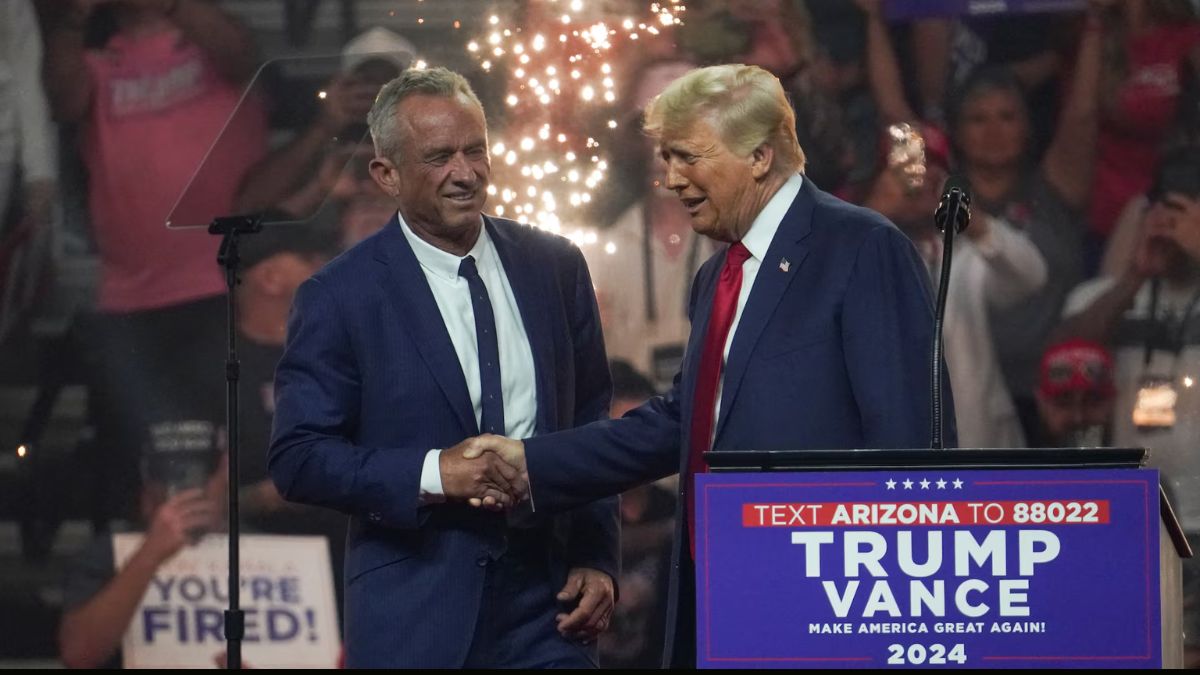
Though no opinion poll has shown a massive difference between vice-president (V-P) Kamala Harris and former President Donald Trump, her current lead in the seven battleground states, especially Pennsylvania, Wisconsin and Michigan, and nationally has fired up the once-dejected Democrats.
Surveys by topline polling companies and media houses in August show Harris leading Trump by 3-5 per cent.
A Morning Consult poll of registered voters shows Harris leading Trump by 48 to 44 per cent. An Ipsos/ABC News/The Washington Post poll shows her leading by 49 to 45 per cent. A CBS News/YouGov poll Harris leading Trump by 51 to 48 per cent. She leads him by 50 to 46 per cent in an Emerson College poll.
A RealClearPolitics polling average of 12 polls found Harris leading Trump by 48.2 to 46.7 per cent. FiveThirtyEight’s weighted average shows Harris ahead by 46.6 to 43.8 per cent.
The Trump campaign has dubbed the Harris buoyancy as her “honeymoon period”. In a confidential memorandum dated July 23, Republican pollster and strategist Tony wrote: “…. The Democrats and the MSM [mainstream media] will try and tout these polls as proof that the race has changed.”
Even David Axelrod, Democratic strategist and former senior adviser to Barack Obama, also feels that “there’s a lot of irrational exuberance on the Democratic side”. “This is going to be a hard fight for either side,” he told CNN in early August.
The most serious warning came from Future Forward, a super political action committee that has raised hundreds of millions of dollars to back Harris. “Our numbers are much less rosy than what you’re seeing in the public,” said Chauncey McLean at an event hosted by the University of Chicago Institute of Politics on August 19. “We have it tight as a tick.”
Opinion polls are inaccurate at times
Gallup polling was always accurate in predicting the outcome of presidential elections and the winner’s margin of victory except in 1948 (Truman vs Dewey), 1976 and 2004 and the popular vote in 2000.
In 1976, opinion polls showed Democrat challenger Jimmy Carter leading in the 51-54 per cent range to incumbent Gerald Ford’s 32-40 per cent in August-September. By October, his lead had reduced to one per cent.
Carter won 50.08 per cent of the popular vote and Ford 48.01 per cent. The difference between the actual result and the final poll for Carter was +2.08 per cent.
The 2000 election was the only presidential election since the Truman upset in which the final pre-election polls incorrectly predicted the winner of the popular vote.
Opinion polls showed Republican George W Bush leading incumbent V-P Al Gore in the 40-56 per cent range in August, September and October. In November, Bush was still leading but by 2-4 per cent.
However, Gore won 48.38 per cent of the popular vote and Bush 47.87 per cent. The difference between the actual result and final poll was +2.38 for Gore.
In 2004, Bush led his Democratic rival John Kerry in the 48-52 per cent range in August, September and October. But by October-end, they were tied at 49 per cent.
Bush won 50.73 per cent of the popular vote and Kerry 48.26 percent. The difference between the actual result and final poll for Bush was +1.73 per cent.
2016 election opinion polls
In 2016, all opinion polls, excluding the UPI/CVoter poll and the University of Southern California (USC)/Los Angeles Times, correctly predicted Hillary Clinton winning the popular vote but overestimated her lead size. Around 88 per cent of national polls overstated her support among voters.
On Election Day, BBC showed Clinton leading Trump by 48.0 to 44.0 percent, HuffPost Pollster 47.3 to 42.0 per cent, The New York Times 45.9 to 42.8 per cent, RealClearPolitics 46.8 to 43.6 per cent and TPM Polltracker 48.8 to 43.9 per cent. However, the results showed Clinton beating Trump by 48.2 to 46.1 per cent.
Why the opinion polls were wrong?
First, most polls, especially in the states, weren’t weighted by education. According to the American Association for Public Opinion Research (AAPOR), weighting is “an attempt to ensure that the sample more accurately reflects the characteristics of the population from which it was drawn and to which an inference will be made.”
Pollsters didn’t properly account for white, non-college-educated voters. A December 2016 survey conducted by Pew Research Center found that 64 per cent of white non-college voters—44 per cent of the electorate—voted for Trump compared to only 28 per cent for Clinton.
An AAPOR report evaluating the 2016 polls found that several polls, especially at the state level, “didn’t adjust their weights to correct for the overrepresentation of college graduates in their surveys, and the result was overestimation of support for Clinton”. Less-educated people are more unlikely to participate in surveys.
Besides, the “frustration and anti-institutional feelings that drove the Trump campaign may also have aligned with an unwillingness to respond to polls. The result would be a strongly pro-Trump segment of the population that simply did not show up in the polls in proportion to their actual share of the population”, the Pew survey stated.
Second, Trump’s ‘shy voters’ lied to pollsters thinking that admitting their support would be socially undesirable.
According to Robert C Cahaly, who founded the Atlanta-based Trafalgar Group, the only opinion polling company that correctly predicted Trump’s victory, his supporters were called “Deplorables” and other unflattering names.
Most voting companies missed the ‘shy Trump voter’ phenomenon in 2016, “which resulted in a major loss in public confidence for polling flowing the election”, he tweeted in September 2022.
In 2016 Trump supporters were called “Deplorables” and other unflattering names. This was a major contributor to the “shy Trump voter” phenomenon that “most” polling missed which resulted in a major loss in public confidence for polling flowing the election.
— Robert C. Cahaly (@RobertCahaly) September 17, 2022
The phenomenon is somewhat similar to “Bradley effect”. Los Angeles’ African-American Democrat mayor Tom Bradley lost the California gubernatorial election to Republican George Deukmejian in 1982 despite polls showing him ahead. White voters lied to pollsters that they were going to vote for Bradley to avoid racial bias criticism.
Though Cahaly’s prediction about the shy voter phenomenon repeating itself in the 2020 election was wrong.
Third, polling companies developed models based on assumptions about who will vote. However, 4 in 10 Americans eligible to vote didn’t turn out. Tens of millions of registered voters didn’t vote with the share of who didn’t like both Clinton and Trump or their campaign issues reaching a new high of 25 per cent, according to a June 2017 Pew survey.
Fourth, it’s tough to predict the way undecided voters will vote. According to FiveThirtyEight, 2016 had the fourth highest percentage of undecided voters (18.5) 100 days before Election Day and the third highest (12.5) on November 8 since the 1972 presidential election.
Undecided voters overwhelmingly voted for Trump, per exit polls—54 per cent voted for Trump and 37 per cent for Clinton in Pennsylvania, Wisconsin 59 to 30 per cent, Michigan 50 to 39 per cent and Florida 55 to 38 percent, giving him 75 electoral votes. Even in 1980, this vote bank contributed to Ronald Reagan’s victory.
2020 election opinion polls
In 2020, 529 national presidential polls were conducted, including 66 by 38 pollsters between October 21 and November 3. Ninety-three per cent of national polls overstated Biden’s support among voters, the largest polling error in more than 40 years, when support for Carter was overestimated by 6 per cent.
Among polls conducted in the last two weeks before the election, the average signed error on the vote margin was too favourable for Biden by 3.9 per cent in the national polls and 4.3 per cent in statewide presidential polls, according to an AAPOR report evaluating the 2020 polls.
Several reasons could have contributed to the polling error.
First, an unexpectedly large number of voters, including non-regular voters, cast ballots—66 per cent of eligible voters voted, the highest rate for any national election since 1900. Nationwide, 22 million more certified votes were cast compared to 2016. Therefore, contrary to the expectations of pollsters, Trump added 10.1 million voters, including white blue-collar voters, undetected by opinion polls.
Second, Trump supporters were reluctant to participate in polling after he dubbed them “fake”. In June 2019, he tweeted: “Only Fake Polls show us behind the Motley Crew. We are looking really good, but it is far too early to be focused on that. Much work to do! MAKE AMERICA GREAT AGAIN!”
Only Fake Polls show us behind the Motley Crew. We are looking really good, but it is far too early to be focused on that. Much work to do! MAKE AMERICA GREAT AGAIN!
— Donald J. Trump (@realDonaldTrump) June 17, 2019
Therefore, the final number of pro-Trump voters was more than the polls indicated. The greatest errors occurred where his support was largest, according to AAPOR.
Third, incorrect assumptions about who would vote could have caused errors. “Pollsters routinely adjust their samples to account for those excluded from the sample, those unwilling to respond and likely voters, but these adjustments may have predicted an electorate that did not materialise,” AAPOR stated. Perhaps, pollsters postulated an electorate that was “too Democratic” because of assumptions about age, race or even partisanship of the electorate.
Fourth, education weighting, unlike in 2016, didn’t help either. Biden fared far better than Clinton among non-college white voters, state and national polls found. However, final national polls showed Trump leading by 58 to 37 per cent among non-college white voters.
Margin of error
The margin of error in a poll shows the range within which its figures would fluctuate if the poll was carried out repeatedly.
Josh Clinton, professor of political science at Vanderbilt University (Nashville, Tennessee), who chaired the AAPOR special task force on evaluating the 2020 polls, said, “People sometimes think that just because there is a number attached [margin of error] that it must be precise.”
According to him, readers should double the margin of error, and if the difference between the two nominees is within the doubled margin of error, it is hard to conclude who is ahead.
An August 2020 Pew report also stated that the real margin of error is often double the one reported. The margin of error addresses only the fact that random samples are likely to differ a little from the population just by chance.
Nonresponse, coverage error and mismeasurementare the three other equally important sources of error not included in the margin of error. “Several recent studies show that the average error in a poll estimate may be closer to 6 percentage points, not 3 implied by a typical margin of error.” Therefore, this hidden error shows that opinion polling is not precise enough to call the winner in a close election.
A study conducted by Stanford University, Columbia University and Microsoft Research and examined by The New York Times in October 2016 found a margin of error ranging between 12 and 14 points in 4,221 late-campaign polls done for 608 state-level presidential, Senate and governor’s races between 1998 and 2014.
Tight 2024 race, media cherry-picking
In a closely divided electorate and a tight Harris-Trump contest, only a highly precise polling can predict results. It is too early to conclude anything if Harris is leading in some recent polls and Trump in others with around two months left to Election Day. Harris can win or lose; the same applies to Trump.
Harris leads Trump by 50 to 43 per cent nationally in the latest Fairleigh Dickinson University survey. She also leads him among independents 38 to 33 per cent.
According to famous American statistician and poker player Nate Silver, who predicted the results in 49 of the 50 states in the 2008 presidential election and was highly accurate in the 2012 and the 2020 White House races, Harris will continue to rise in the polls after the DNC. “That’s what we call a convention bump or a convention bounce,” the FiveThirtyEight founder added.
On the other hand, a new national head-to-head poll by the conservative-leaning Rasmussen Reports, which was among the closest firms to correctly predict the 2016 election result, found Trump leading Harris by 49 to 46 per cent.
A polling in swing states conducted by Navigator Research found Harris not leading in a single battleground state. She was tied with Trump in Michigan, North Carolina and Wisconsin and behind in Arizona and Pennsylvania. The race is tied at 45 per cent in the battleground states when third-party candidates are included.
In RealClearPolitics’ battleground state estimate, Trump wins every major battleground state except Wisconsin, securing 287 Electoral College votes to Harris’s 251.
A few voters can change or affect the margin between candidates—and that’s what the media fails to grasp.
A March 2021 Pew report considered a hypothetical poll of 1,000 adults. One version showed Biden prevailing over Trump by 12 per cent, the largest lead seen in a national poll released by The Washington Post and ABC News two weeks before Election Day. The other Pew version showed the actual 2020 election results nationally with Biden having an advantage of 4.4 per cent.
According to Pew, only 38 of the 1,000 adults were needed to vote for Trump to change Biden’s margin from 12 to 4.4 points.
In 2016, the media relied too much on opinion polls with news reports feeding the sense that Clinton would win the election. Major media outlets failed to understand probabilities in the polling data.
In a March 2017 interview with The Harvard Gazette, Silver, then-editor-in-chief of FiveThirtyEight.com, said, that the mainstream media perpetuating the narrative that the polls got it wrong is “pretty irresponsible”.
Silver doesn’t blame the 2016 opinion polls. “If you go back and read The Times [NYT], they say point-blank, basically time and time again, ‘This is a sure thing for Hillary Clinton.’ They don’t attach a percentage to it, but that’s extremely clear from their reporting. And then, the day after the election, they blame the polls and their data site. That’s pretty irresponsible,” Silver said.
In the 11th and final article in the series ‘The Real Story of 2016’, which reviews news coverage of the 2016 election, Silver wrote on September 21, 2017: “In recent elections, the media has often overestimated the precision of polling, cherry-picked data and portrayed elections as sure things when that conclusion very much wasn’t supported by polls or other empirical evidence.”
For example, an August 1-20 Gallup poll found that Harris’s favourability rating increased from 37 per cent in June to 47 per cent in August. Trump’s favourability was rating down from 46 to 41 in the same period.
Gallup also mentioned the percentage of Americans who don’t favour Harris (49), Trump (55) and his running mate JD Vance (48).
However, most media reports carried only Harris’s favourability rating. An average of 178 polls published by The Hill on August 24 showed that 50.8 per cent of Americans favour her and 45.0 per cent don’t. FiveThirtyEight’s average of 11 polls published on August 23 showed that 47.1 per cent of Americans don’t favour her and 45.2 per cent favour.
As Silver wrote: “As I’ve documented throughout this series, polls and other data did not support the exceptionally high degree of confidence that news organisations such as The New York Times regularly expressed about Hillary Clinton’s chances. So, if the polls called for caution rather than confidence, why was the media so sure that Clinton would win?”
Highlighting the media bias, Silver wrote: “Journalists just didn’t believe that someone like Trump could become president … So, they cherry-picked their way through the data to support their belief, ignoring evidence—such as Clinton’s poor standing in the Midwest—that didn’t fit the narrative.
Moreover, the media’s “relatively poor grasp of probability and statistics also played a part: It led them to misinterpret polls and polling-based forecasts that could have served as a reality check against their overconfidence in Clinton”.
Actually, both pollsters and the media should share the blame when results contradict polls.
For instance, the Truman-Dewey contest was very close but pollsters were too confident of the accuracy of their methods. They assumed that voting intentions would not shift in the last two weeks of the campaign. One in seven voters decided in the last two weeks and three out of four voted for Truman.
The media also failed to analyse and interpret a Gallup poll before Election Day showing Dewey’s lead tanking from 17 per cent in late September to 9 per cent in October and to a mere 5 per cent at month-end.
Political columnists in major magazines and newspapers wrote articles proclaiming Dewey’s victory in advance. The Life magazine published a large photo in its final edition before the election titled “Our Next President Rides by Ferryboat over San Francisco Bay” showing Dewey and his staff riding across the city’s harbour. More than 500 newspapers endorsed Dewey compared to Truman’s 182.
Of course, the Tribune scripted the most embarrassing chapter in its history.
The writer is a freelance journalist with more than two decades of experience and comments primarily on foreign affairs. Views expressed in the above piece are personal and solely those of the writer. They do not necessarily reflect Firstpost’s views.
 "Russian drones over Poland: Trump’s tepid reaction a wake-up call for Nato?")
 "As Russia pushes east, Ukraine faces mounting pressure to defend its heartland")
 "Why Mossad was not on board with Israel’s strike on Hamas in Qatar")
 "Turkey: Erdogan's police arrest opposition mayor Hasan Mutlu, dozens officials in corruption probe")


