 "S&P 500 waits while other US indexes make new highs")
[caption id=“attachment_654001” align=“alignleft” width=“600”]
 Dow Chart[/caption]
by George Albert
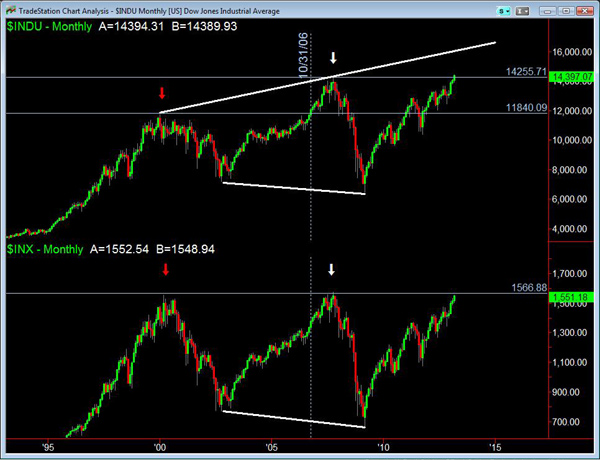
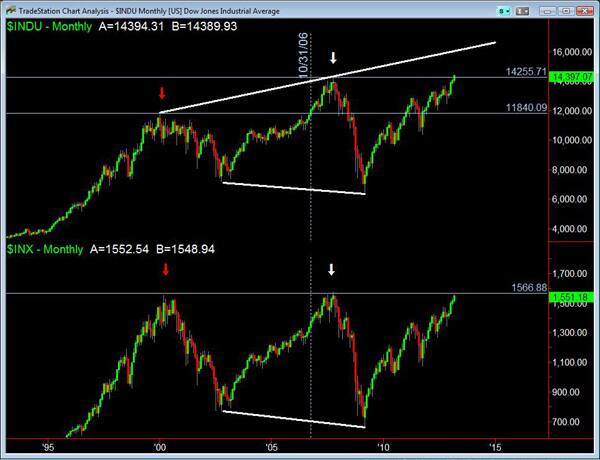
The bears watched in disbelief when the Dow crossed its previous high to close the week at 14,397 an all time high. Dow is the third major US index to cross its 2007 high following the tech-heavy Nasdaq-100 and the small cap index Russell 2000. Now only the mighty S&P 500 remains below its 2007 highs.
So how do the leading indexes of the globe Dow, Nasdaq and Russell 2000 make new highs with US unemployment still so high, stubbornly high debt and deficits, continuing troubles in Europe and slowdowns in India and China. The answer is simple. The central banks of the world have been printing money and the excess liquidity is moving into speculative assets like equities. This essentially means that despite bad news there is money on the sidelines that can keep the stock markets up.
However, a big catalyst can turn the market lower. It could be a default by one of the European countries or a sharp worsening of the US fiscal situation caused by rising stock prices. Rising stock prices can push up interest rates forcing the US government to pay higher interest on its bonds making the fiscal condition dire. However till such time we could see the markets inch up spoiling all bear bets based on economic fundamentals. There is a saying among traders, “The markets can stay irrational longer than you can stay solvent.”
[caption id=“attachment_654007” align=“alignleft” width=“600”]
 Nasdaq-Russel combined chart[/caption]
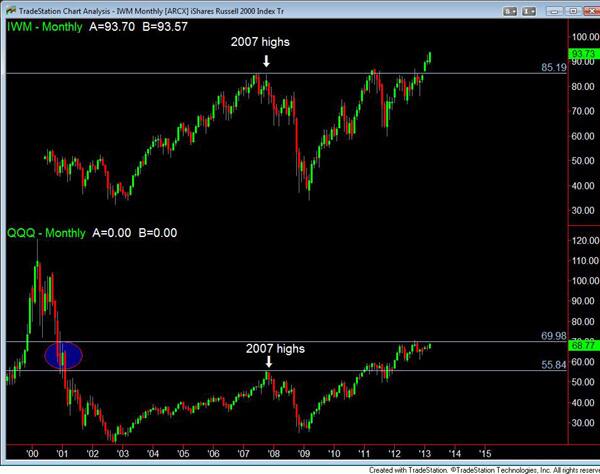
So let’s see what the four US indexes are telling us. For the Russell 2000 and Nasdaq 100 we are using their respective exchange traded funds, IWM and QQQ. (See above for the combined chart of the Russell and Nasdaq). First you’ll notice that both the indexes have rallied above their 2007 highs. The Russell has no overhead resistance in price. The Nasdaq on the other hand quite has a few resistance levels. Now let us take a look at the Dow and the S&P 500 chart (top of the page) The Dow chart is on top and the S&P 500 at the bottom. You’ll notice that the Dow has cleared its 2007 highs and now does not have any overhead resistance in price. The S&P 500 still has to clear its 2007 highs. If that high is cleared there will be no resistance in price for the S&P 500. Then technical traders will have to look to the Nasdaq for resistance price as the index is well below its 2000 highs reached during the dot com bubble.
As prices make new highs the strategy of using resistance to take profit on long positions or initiating short positions does not work. So one has to move to using other indicators or tools. We are not there yet as we have a lot of resistance areas on the Nasdaq and the S&P 500 still has to clear it’s all time high. Given that the other three indexes have crossed their 2007 highs it is likely that the S&P 500 will too. Once the S&P 500 does, we will have to look at the Nasdaq for resistance, which almost 50% below its all time high touched in 2000. In fact the Nasdaq has been held back by resistance for nearly a year. The resistance level is from 2001 and shown by the blue ellipse on the Nasdaq (QQQ) chart. Since markets are inter connected, the resistance of one indedx can stop, reverse or the rally in others.
So how does one trade when price is making new highs. On long positions one should keep moving up stop loss levels, below newly formed support areas. One can short only when the market has fallen from a certain point and then rallies back up to it. If the trend continues to be bullish, profits on short positions should be booked quickly.
Now let’s look at the chart of the S&P 500 and Dow more closely. As mentioned earlier the Dow has already made a new high. The previous high is shown by the white arrow. Notice that the Dow made new highs when the S&P 500 did not. The 2002 highs of both indexes are shown by the red arrows. The vertical line shows when Dow broke above its 2002 highs to rally higher in 2006. However, notice that the S&P 500 did not rally above its 2002 highs. So the Dow has shown a propensity to rally higher than the S&P 500. In 2006 the Dow had rallied 20% higher than its previous peak and that rally lasted nearly a year. It could do that again.
The other thing to keep in mind is that when the Dow broke its 2002 highs in 2006 the S&P was far behind and so was the Nasdaq. But that is not true this time as the S&P is very close to its all time highs and Nasdaq has already broken its 2007 highs. The Russell 2000 is a different story and way higher than its 2002 highs. Given state of the other three indexes the S&P 500 is also likely to hit new highs.
Interestingly the Dow has been forming a broadening chart pattern since 2000 as shown by the white lines. The S&P on the other hand has a lower low but not a higher high. In a broadening formation price forms lower lows and higher highs not giving a clear sense of trend. That has been the case with both the S&P 500 and Dow. In term of nominal value the S&P 500 is where it was in 2000. However if the broadening formation holds true our calculations indicate that the Dow might reach 16,500 and also take the S&P 500 up with it.
George Albert is Editor, www.capturetrends.com