
 "Silver faces last hurdle before blast off, but there's a caveat")
Silver has reached a key level beyond which it can rally strongly, but an inability to clear the area can lead to a selloff. This is a critical juncture for the white metal and bulls should buy only if the level is crossed.
Silver prices are at a resistance zone and prices often fall from resistance levels. Bears, on the other hand, can short the metal at the resistance level and hope for a selloff. Normally we’d only suggest shorting silver at the current level of resistance, but price action before the level has made us cautious on the short side. Investors who are holding silver positions should at least take some profits.
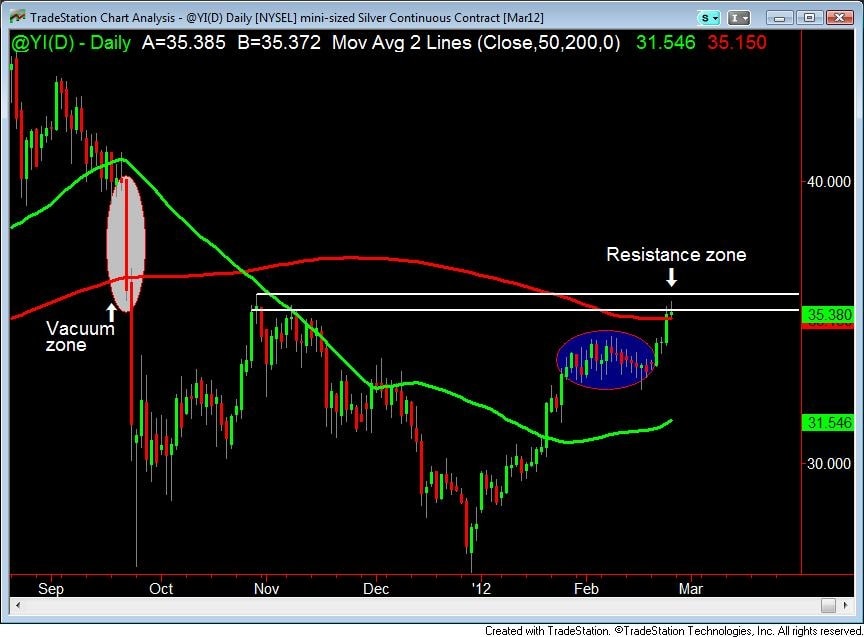
We are looking at the silver futures contract ( click here for the chart ) and notice that prices have rallied up to a level from where it sold off in November 2011. Generally, prices turn when they reach previous turning points, which for silver is at the $36 level. A close above that level can take the white metal all the way to $40.
[caption id=“attachment_224879” align=“alignleft” width=“380” caption=“Silver has reached a key level beyond which it can rally strongly, but an inability to clear the area can lead to a selloff. This is a critical juncture for the white metal and bulls should buy only if the level is crossed. Reuters”]  [/caption]
Once the level is cleared prices enter what we call a vacuum zone - as shown by the white ellipse on the chart. Vacuum zones are areas where prices move very fast due an an extreme imbalance of buyers and sellers. Notice that prices fell pretty sharply in the area marked as a vacuum zone. What it implies is that the number of sellers far exceeded buyers. Put differently there were not many buyers in that area.
Now let’s take it a step further. Past buyers tend to be future sellers. Since there were not many buyers in the vacuum zone in the past, there aren’t going to be too many sellers in future. This will mean that prices can move up with relative ease. However, the signal for going long will be only when silver closes above $36.35. Even though the actual level is $36, we prefer to give some margin, before turning bullish.
The other factors favouring a rally in silver are the moving averages. The green line is the 50-day simple moving average (SMA) and the red line is the 200-day SMA. SMAs are average prices over a specified period and their slope shows the trend of the market. Notice that silver’s 50-day SMA is sloping up and prices are above it, indicating that the medium term trend is bullish. The 200-day, on the other hand, has stopped sloping down and turned flat, indicating that the bearish trend has paused or ended.
Also notice that prices have closed above the 200-day SMA - which is a positive. But the only hurdle now is that prices are at resistance. Bears would argue the confluence of the 200-day SMA and resistance is an indication that prices could fall. But that rationale might not hold true for silver now.
Remember resistance levels are areas where sellers exceed buyers. But notice that prices consolidated before resistance levels as shown by the blue ellipse. This usually means that sellers at the resistance level might have been taken out. So even if there is a selloff now, it might not be major. The fall to bring prices to the consolidation area, before they stabilise.
Since prices are at a critical juncture, anything can happen. So one should trade cautiously and go long only if the resistance level is broken. However, bears can take short positions anticipating a selloff. They should get out their positions if prices close above $36.35.
George Albert is Editor, www.capturetrends.com
 "Israel targets top Hamas leaders in Doha; Qatar, Iran condemn strike as violation of sovereignty")
 "Nepal: Oli to continue until new PM is sworn in, nation on edge as all branches of govt torched")
 "Who is CP Radhakrishnan, India's next vice-president?")
 "Israel informed US ahead of strikes on Hamas leaders in Doha, says White House")


](https://images.firstpost.com/wp-content/uploads/2012/02/silver.jpg)