
 "Short-term bull view: Nifty on course to hit 5,350")
Special to Firstpost
S&P CNX Nifty (5,146.05): The Nifty index displayed considerable resilience during the week gone by. Despite the not-so-conducive news flow, the index managed to hold ground, which is a sign that the bullish camp is in charge of the proceedings.
A look at chart patterns in the index heavyweights supports the bullish view. The Nifty appears to be on course to hit the target of 5,350 mentioned in the week before. The first support is at the 4,900-4,950 range while the more significant support lies at 4,750-4,800.
A look at the technical picture in individual stocks suggests that it is far easier to trade stocks than the index, owing to the spike in volatility. The problem with a volatility spike is that the stop-loss would have to be wider in order to accommodate the expansion in volatility. Reducing the bet-size or the position-size is a sensible move amidst a pick-up in volatility.
CNX Bank Index (10,038.35): The index took a drubbing last Monday after the Reserve Bank of India decided to keep policy rates unchanged. It is, however, positive to note that the index recovered in the subsequent trading sessions. The price action last week does not alter the positive outlook and the index remains on course to hit the target of 10,600.
The short-term bullish view would be under threat if the Bank Nifty falls below the support at 9,300. Individual stocks such as IDFC, Bank of Baroda, Bank of India, Punjab National Bank and Bank of Baroda appear more compelling from a trading perspective.
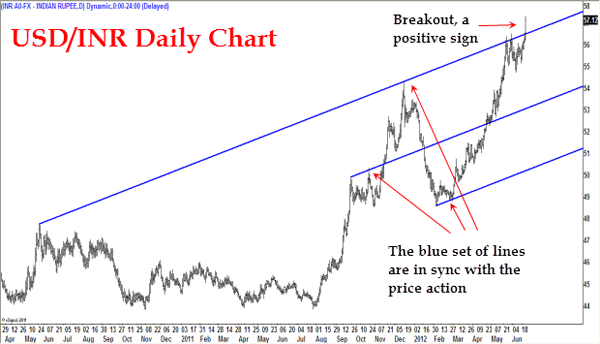
USD/INR (Rs 57.16): After a contraction in volatility the week before, this currency pair saw an explosive move during the week gone by. As anticipated, the breakout past the bullish trigger level of Rs 56.30 imparted momentum to the uptrend and the US dollar hit an all-time on Friday. ( See chart below)
[caption id=“attachment_354861” align=“alignleft” width=“600” caption=“The US dollar has now moved past the upper blue trendline which has acted as a barrier in earlier occasions.”]  [/caption]
As highlighted in the attached chart, the US dollar has now moved past the upper blue trendline which has acted as a barrier in earlier occasions. This strengthens the short-term bullish view for the dollar and a rally to the next target of Rs 58.10 appears likely.
Unless the dollar falls below Rs 54.70, the path of least resistance would be on the way up for the greenback.
Tata Power (Rs 94.50): This stock has been in a downtrend since its 21 February high of Rs 121.20. The recent price action suggests that the downtrend is complete and a rally to Rs 110 appears likely.
[caption id=“attachment_354860” align=“alignleft” width=“600” caption=“The recent price action suggests that the downtrend is complete and a rally to Rs 110 appears likely.”]  [/caption]
Long positions may be considered with a stop-loss at Rs 88, for a target of Rs 110. The uptrend would gain momentum on a breakout past Rs 110 and the stock could then target the next resistance at Rs 120.
(The views and recommendations featured in this column are based on a technical analysis of historical price action. There is a risk of loss in trading. The author may have positions and trading interest in the instruments featured in the column.)
 "Israel targets top Hamas leaders in Doha; Qatar, Iran condemn strike as violation of sovereignty")
 "Nepal: Oli to continue until new PM is sworn in, nation on edge as all branches of govt torched")
 "Who is CP Radhakrishnan, India's next vice-president?")
 "Israel informed US ahead of strikes on Hamas leaders in Doha, says White House")


](https://images.firstpost.com/wp-content/uploads/2012/06/USDINR2306.png)
](https://images.firstpost.com/wp-content/uploads/2012/06/Tatapower2306.png)