 "Sensex, Nifty hammering support, will we have a break down?")
The Indian indexes are hammering support, increasing the probability that prices may go lower. The more times a support level is hit greater the chances of a breakdown.
Areas of support are levels where demand for stocks exceed supply, which can lead to a rally in price or at least a pause in the price drop. Resistance levels on the other hand are areas where the supply of stocks exceed demand leading to a drop or at least stagnation of a rally.
 The more time prices stay at support shows that buyers are unable to push prices higher as there are a large number of sellers. Now at the final count if sellers exceed buyers at the support level, prices will break. Let’s see if that happens to the Sensex and Nifty.
The indexes are at support levels that we had marked on the charts last week with blue horizontal lines. The levels are also shown by white arrows. (See the combined chart of Sensex and Nifty below)The indexes hit their respective support levels on Tuesday and have not been able to break it. If that support level is broken, we could see the indexes moving down to the next support level. The support level to be broken for prices to drop is between 5800 and 5860 on the Nifty and the corresponding zone on the Sensex is between 19,590 and 19,790. The support level below that on the Nifty is between 5680 and 5740 and for Sensex it’s between 19,270 and 19,450.
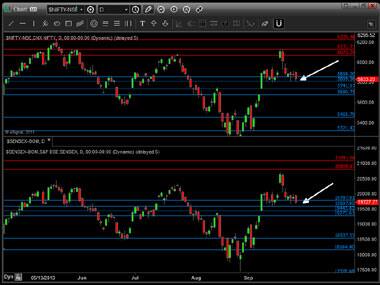 There is not much room between the two support levels to warrant taking a short position now. Plus one should never take a short position when prices are at support. The indexes are at a good spot for investors to cover at least part of their short positions and move their stop losses lower. The current fall still looks like a correction rather than a reversal. Additionally the decision by the US Federal Reserve to continue on its monetary easing path is bullish for stocks, even if the climb may be slow.
The good news for bulls is that the support level has held for so long. The other facts support the bull is that the support on the S&P 500 has held. The support levels are marked on the chart by white horizontal lines. (See combined chart of the S&P 500 and Dow below) We are using SPY the S&P 500 ETF to track the index and for the Dow we are using DIA. The SPY is on top and DIA below. On the SPY chart only will you see that prices are at support, but it is also close the 50-day simple moving average (SMA) which provides additional support. The 50-day is shown by the up sloping white line. DIA on the other had has broken support and is below its 50 SMA. So that sends a mixed signal to the markets.
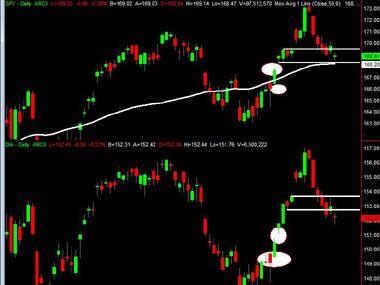
Looking at the US charts it seems that a big sell off is not on the cards. Apart from the support levels shown by the horizontal lines we have quite a few gaps that will act as support. The gaps are marked by white ellipses. Gaps happen when prices close at a certain level and then open much higher or lower the following day. A gap higher shows areas of extreme demand and when prices come back to the gap level the either bounce of pause falling.
So the trading strategy for bears should be to take some profits now and wait for the markets to fall to the lower support level on the NIFTY and Sensex. We’d also move the stops on the NIFTY to the 5900 level and on the Sensex to the 20,050 level. Bulls on the other hand can take a long position with stops below last week’s low.
The final wild card is the discussion of the debt ceiling in the US. A failure to raise it could lead to a fall in the markets.
George Albert is a Chicago-based trend watcher and edits www.capturetrends.com