Special to Firstpost
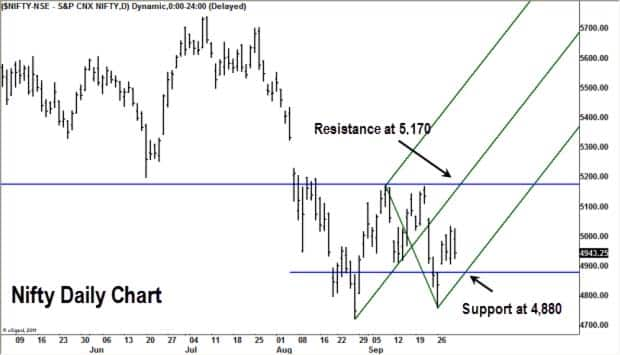
S&P CNX Nifty (4,943.25): The index seems to be coiling within the range of 4,720 on the lower side and 5,170 on the higher side. This ranging price action is not surprising if viewed in the context of the sharp slide since the 4 April high of 5,945.
Until the index moves above the major swing high of 5,945, the medium-term trend will remain bearish and a fall to the next support at 4,680 is the preferred view.
[caption id=“attachment_97115” align=“alignleft” width=“380” caption=“From a short-term perspective, it is positive to note that Nifty has formed a relatively higher low of 4,758 on 26 September.Reuters”]
 [/caption]
Within this framework, a breakout above the minor resistance at 5,230 could offer some room on the upside, but would not indicate a reversal of the downtrend. Those wanting to take positional shorts may wait patiently until this ranging action resolves itself.
From a short-term perspective, it is positive to note that the index has formed a relatively higher low of 4,758 on 26 September. Compulsive traders may consider long positions on weakness, with a stop-loss at 4,700 and target of 5,130. A breakout past 5,130 could trigger a rally to the significant resistance at 5,230.
BSE Sensex (16,453.76): The index has been stuck in the 15,765-17,210 range in the past few weeks. A fall below 15,765 would indicate continuation of the recent downtrend. As long as the index trades above 15,765, there would be a case for a bounce to 17,210.
Like the Nifty, the index would have to move above the 4 April swing high of 19,812 to indicate a reversal of the medium-term downtrend.
[caption id=“attachment_97114” align=“alignleft” width=“620” caption=“Nifty”]
 [/caption]
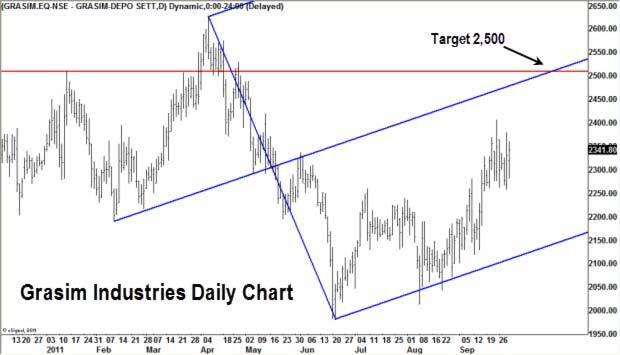
Grasim Industries (Rs 2,343.60): The sequence of higher highs and higher lows formed since 20 June is a sign that the stock is in a short-term uptrend. Chart patterns indicate that the stock could rally to the short-term resistance at Rs 2,500.
Long positions may be considered on declines, with a stop-loss at Rs 2,150, for an initial target of Rs 2,500. A breakout past Rs 2,500 would push the stock to the major resistance at Rs 2,610.
[caption id=“attachment_97113” align=“alignleft” width=“620” caption=“Grasim”]
 [/caption]
Chambal Fertilisers (Rs 93.45): The stock has been in a downward corrective phase since 12 September. The MACD (moving average convergence divergence) indicator is in a sell mode, confirming the bearish undertone. The stock appears to be headed to the immediate support at Rs 86.
Those already invested may use any rally to pare exposures. Traders may use the uptrend to consider short positions with a stop-loss at Rs 113 and target of Rs 86.
(The views and recommendations featured in this column are based on a technical analysis of historical price action. There is a risk of loss in trading. The author may have positions and trading interest in the instruments featured in the column.)
)