
 "Sensex high: A correction to bullish market looks imminent")
The market is rejoicing the rally of the Sensex to new highs and the Nifty close to its all time high. However, the rally is not showing strength and possibly due for a correction which means bulls need to be cautious.
The long term bullish trend is still intact, but ideally one should wait for the correction before going long.
The Nifty chart is telling us to be cautious and showing a pattern that in the past has led to correction.
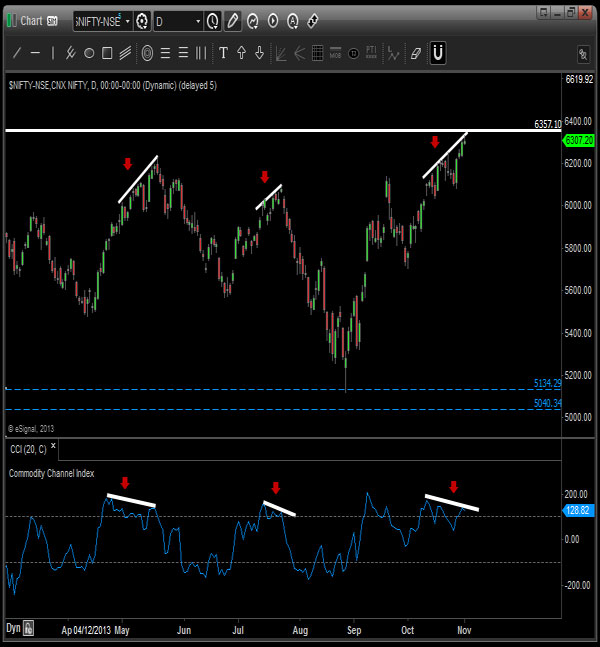
[caption id=“attachment_1207753” align=“aligncenter” width=“600”]  Nifty[/caption]
On the chart the white horizontal line shows the all time high of the Nifty. You’ll notice that the index has not crossed that level.
Now take a look at the white up sloping lines on the Nifty’s price chart. These are also shown by red arrows. Next take a look at the commodity channel index (CCI) at the bottom of the chart.
CCI shows overbought and oversold conditions in the market, which is what a majority of people use it for. We will, however, use it now to check the strength of the rally. When a rally has strength both the index and the CCI will rise. However, when the rally is losing strength the index will continue to rise but the CCI will fall. Such a situation is called negative divergence.
You will notice that the Nifty is now faced with negative divergence. So does negative divergence really work. To test this we look back at the two recent instances when the markets sold off after a negative divergence. The divergence is shown by the white down sloping lines on the CCI with a corresponding up sloping line on the Nifty. In both cases the index has a strong sell off after the CCI fell below positive 100. Right now the CCI is at 128. A CCI above positive 100 is considered overbought and below negative 100 is considered oversold.
A good time for bears to short is when the index is at resistance and the CCI falls below positive 100. Nifty near all time highs is the strongest resistance in price. This increases the likelyhood of a correction. Remember that this is still a bull market so it can rally pretty quickly after a fall. A few weeks back we had written an article about the bullish cup and handle pattern which could result in the Nifty rallying another 1000 points.
That bull is still in play.
So while shorting the index may a short term play, the ideal thing to look for is a good entry point to this market. We’d look at the CCI to hit the zero point before buying. If the CCI falls below zero the next point of entry would be when the CCI goes below negative 100 and then come back above it. Also on the Nifty 6150 is a good entry point with a stop below 6075.
Now is it possible that the we could see a sharp sell off and a reversal to a bear market. That is a distinct possibility if the Federal Reserve begins to taper its bond buying program. But for now the chart looks bullish. This is the second time that the Nifty is nearing its all time high. The more times the all time high is hit, greater are the chances of a breakout and rally.
So while the bulls may me on the defensive right now, the playing field is still skewed in their favor.
 "Russian drones over Poland: Trump’s tepid reaction a wake-up call for Nato?")
 "As Russia pushes east, Ukraine faces mounting pressure to defend its heartland")
 "Why Mossad was not on board with Israel’s strike on Hamas in Qatar")
 "Turkey: Erdogan's police arrest opposition mayor Hasan Mutlu, dozens officials in corruption probe")


](https://images.firstpost.com/wp-content/uploads/2013/11/nifty-nov-1.jpg)