
 "Precious metals fall on dollar rally")
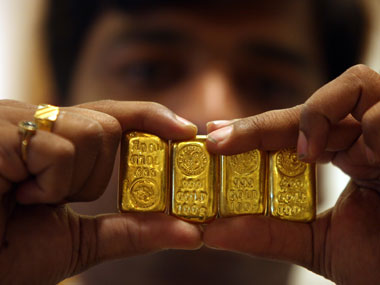
Gold hit a resistance zone last week and fell over six percent in a day before recovering, but silver confounded traders falling nearly 10% after giving a bullish signal.
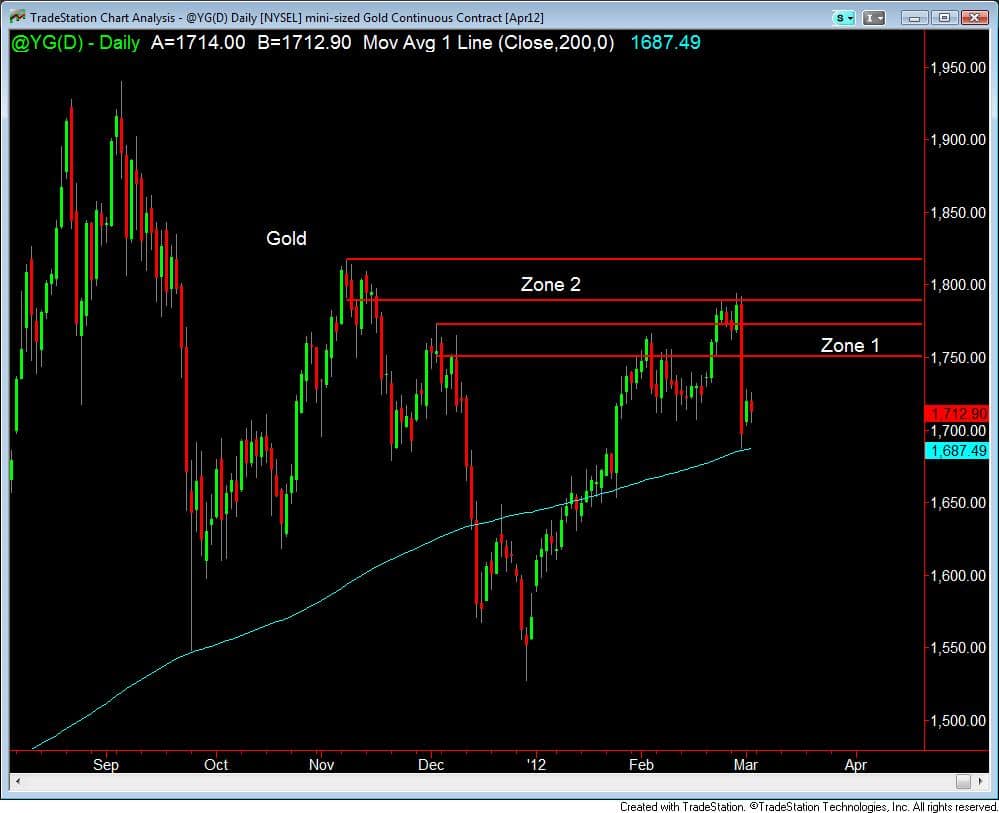
In our article on 28 January , we had mentioned that it was time to go short on gold. (Click here for gold chart)
The article stated that gold had two resistance zones and that the second one was a better level to take a short position, but that the first level could also work. Gold did drop from the first level, but had a huge sell off from the second level. Traders shorting at the second level would have made a huge profit in just one day.
The second zone was better as it would have required a lot of buyers to take out the sellers at the first zone, which meant that the number of buyer remaining as price reached the second zone would be few. This leads to a strong drop, as shown by the fall of gold.
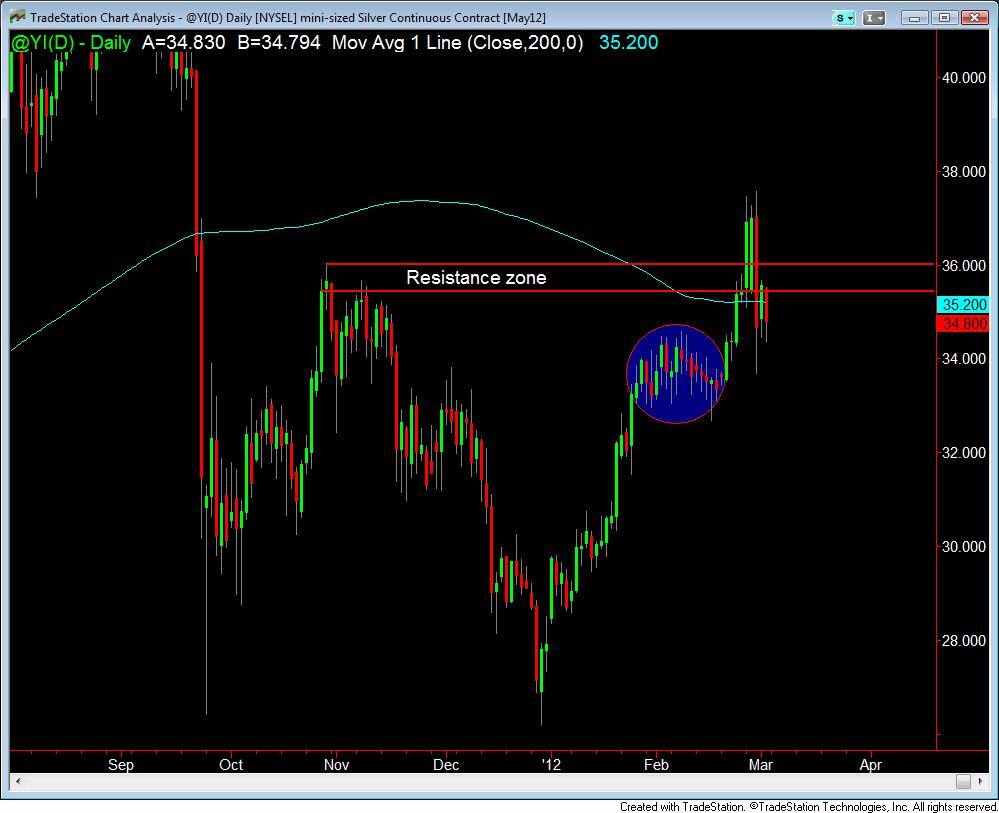
But it’s the fall of silver that confounded traders, including this author (click here for silver chart). Prices broke out of the resistance zone as shown on the chart and closed above it for two days giving a strong bullish signal and then it had a strong fall. One of the reasons for the fall is that silver often follows gold. The second is that both metals sometimes move inversely to the US Dollar, which rallied strongly last week.
[caption id=“attachment_232782” align=“alignleft” width=“380” caption=“Gold hit a resistance zone last week and fell over six percent in a day.”]  [/caption]
So is it game over for the two precious metals. Not so fast. Notice that silver is still hovering near its 200 day moving average as shown by the blue line. And gold bounced off its 200 day moving average. The 200-day moving average is like the Wall of China and can stop prices from falling if the average is sloping up. In the case of gold the average is sloping up and is flat for silver.
Signals on risk
Equities rise and fall based on the risk appetite of investors. To get a sense of where equities are going it makes sense to look at the price action of the most risky assets. If the high risk assets are strong then one can take comfort that equities will rally. And if they are weak it spells bad news.
In any economy it’s the small cap stocks that are the most risky. When markets turn bullish they rally much further than mid and large cap stocks and they also fall harder. Hence we decided to look at the S&P 500 index and the small cap Russell 2000 index to get an inkling of the markets.
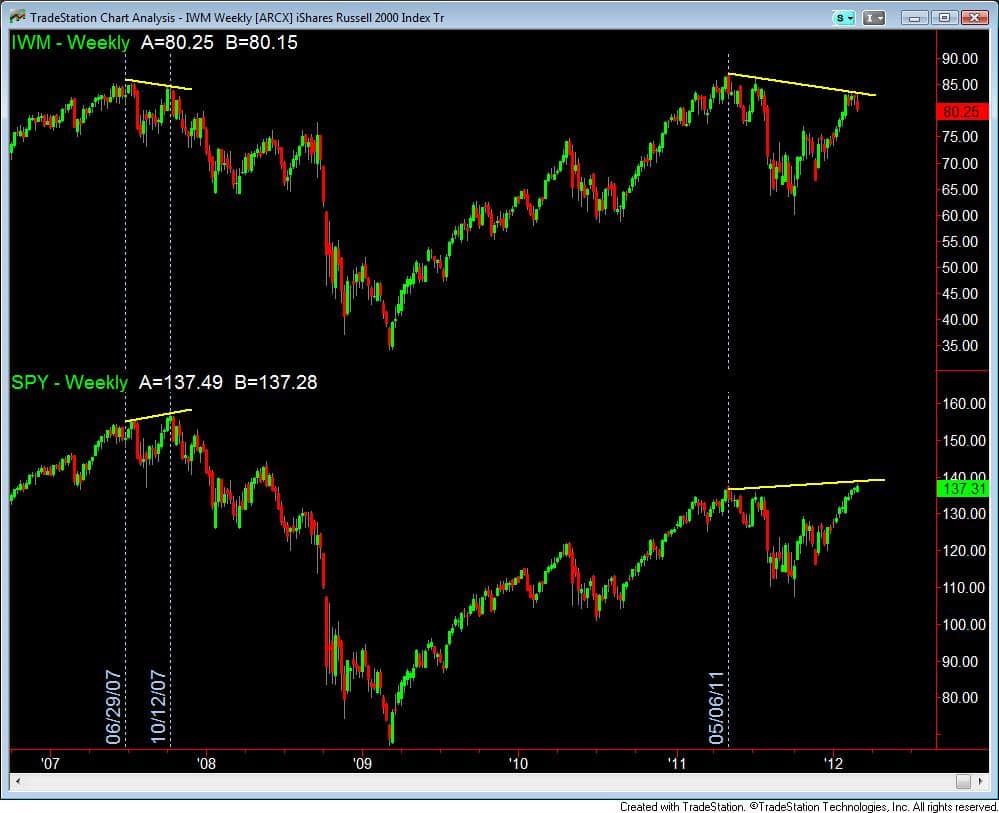
To track the S&P 500 index we are looking at the exchange traded fund, SPY, which tracks the index and for the Russell we are looking at IWM, which is the vehicle to trade the index. (click here to see the comparative chart of IWM and SPY)
First let’s establish the risk sensitivity of the small caps. When investors were risk averse from market peak of 2007 to the bottom of 2009, the small caps fell 60% but the large caps only fell 56%. Then from the 2009 bottom to 2011 top when risk appetite increased IWM rallied 151% but S&P 500 rose 98%. It is hence clear that the small caps are an excellent proxy for risk appetite.
Now a look at the chart will show that the 2007 history seems to be repeating itself.
The small cap ETF, IWM began falling in June 2007, then made a lower high in October 2007, before the crash. A lower high is made when the latest high in price is lower that previous high and a higher high is made when the latest high in price is higher than the previous high. The vertical lines show the dates of the highs. S&P 500 on the other hand made a higher high, giving an impression that the market was bullish and then fell. The rest is history.
Notice history repeating itself again. IWM is making lower highs just like in did in 2007 and the S&P 500 is making high highs. The yellow lines show the higher highs and lower highs. Now it’s possible that the large caps may rally a little bit higher, but unless small caps lead the market, risk is not really back on the table.
George Albert is Editor www.capturetrends.com
 "Israel targets top Hamas leaders in Doha; Qatar, Iran condemn strike as violation of sovereignty")
 "Nepal: Oli to continue until new PM is sworn in, nation on edge as all branches of govt torched")
 "Who is CP Radhakrishnan, India's next vice-president?")
 "Israel informed US ahead of strikes on Hamas leaders in Doha, says White House")


](https://images.firstpost.com/wp-content/uploads/2012/03/goldmine.jpg)