
 "Nifty will remain volatile, rangebound: Sell on rally")
Special to Firstpost
CNX Nifty (5,907.30): The index eked out a modest 2% gain last week. The short-term trend remains bearish and the key reference point for the bullish camp is at the 6,100-6,150 zone. As long as the Nifty trades below this zone, there would be a strong case for a slide to the support zone at 5,350-5,400.
A look at the broader picture indicates that the Nifty is likely to spend some time in a range of 5,350-6,150 for a while. Until these broad reference points are taken out, it would make sense to sell on rally or buy the dips. This is a strategy suited for a range-bound market.
After a strong directional move, the individual stocks as well as the index need time for some rotation or distribution of stocks before the next directional move can begin. Until then a volatile rangebound trend is likely to persist. The volatility would also spike up as and when the earnings report from the corporate sector starts trickling in.
From an extreme short-term perspective, the support at 5,700 is the key level to look forward to. On the higher side, 5,950-5,975 is the resistance zone. At a micro level, the index could oscillate in this range before testing the extremes of the bigger range at 5,350-6,150.
CNX Bank Index (10,197.15): The chart pattern this week, in this index, was no different from the Nifty. The sequence of lower highs and lower lows is still intact and a breakout past 11,300 would indicate the scope for further recovery. Until the index moves above this high at 11,300, there would be a strong case for a test of the support at 8,900.
From a short-term trading perspective, the index has completed a very interesting pattern on Friday. The price on Friday closed right at the “balance area” which is a sign that it is ready to make big move. Rather than guessing the direction of the move, it would make sense to go with the price in the direction of the breakout. The key levels to watch are the Friday’s extremes of 10,330 and 10,100.
A breakout past either of these extremes could trigger a sharp move of at least 350-400 points in the direction of the breakout.
Apollo Tyres (Rs 66.50): The stock has been in a sideways consolidation mode for quite a while now. The price has been gravitating towards the mean or the centre of the recent consolidation range. This a typical sign that the stock is ready for a big directional move.
[caption id=“attachment_1154583” align=“aligncenter” width=“600”] 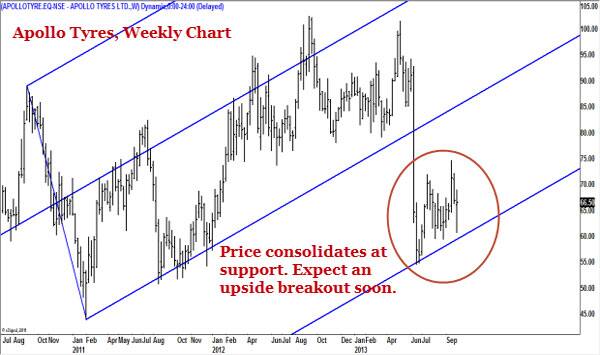 Investors may buy Apollo Tyres with a stop loss at Rs 59 for an initial target of Rs 86. The bullish trend would gain momentum on a breakout past Rs.86 and the stock could then test the major resistance at Rs 94-98 range.[/caption]
Investors may buy Apollo Tyres with a stop loss at Rs 59 for an initial target of Rs.86. The bullish trend would gain momentum on a breakout past Rs.86 and the stock could then test the major resistance at Rs 94-98 range.
Hindalco (Rs.118.40): After a sharp fall, this stock has been in a recovery mode in the past few weeks. The recent price patterns suggest that the stock could seek higher levels from a short-term perspective.
Investors may buy the stock at the prevailing levels as well as on declines, with a stop loss at Rs 108. Profits in long positions may be taken at Rs 130. A fall below Rs 108 would be a sign of weakness and could trigger a slide to Rs.92-95 range.
(The views and recommendations featured in this column are based on the technical analysis of historical price action. There is a risk of loss in trading. The author may have positions and trading interest in the instruments featured in the column.)
 "Russian drones over Poland: Trump’s tepid reaction a wake-up call for Nato?")
 "As Russia pushes east, Ukraine faces mounting pressure to defend its heartland")
 "Why Mossad was not on board with Israel’s strike on Hamas in Qatar")
 "Turkey: Erdogan's police arrest opposition mayor Hasan Mutlu, dozens officials in corruption probe")


](https://images.firstpost.com/wp-content/uploads/2013/10/Apollo0510.jpg)