 "Nifty is building a foundation before the next thrust")
October 26, 2013: Nifty faced with overhead resistance is building a foundation before making its next move. The index has not been able to clear its resistance level and moved sideways, which is not unusual price action.
[caption id=“attachment_1195529” align=“alignleft” width=“380”]
 AFP[/caption]
Resistance levels are areas where the supply of stocks exceed demand leading to a fall in price. The fact that prices have not fallen shows that buyers still have strength and taking out the sellers. If buyers can exhaust all the willing seller, we will see the index move higher. Nifty right now is fighting the resistance level of around 6225. Once that level is broken the next level of resistance is the index’s all time high of 6350. After that level the index has no resistance in price, making it difficult to identify upside targets. But we’ll cross that bridge when we hit new highs.
[caption id=“attachment_1195523” align=“alignleft” width=“380”]
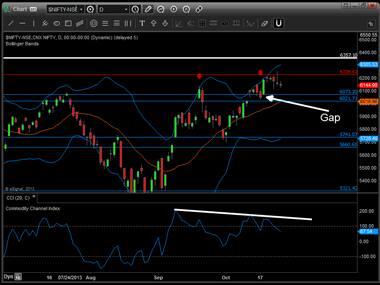 Notice that the up move of the Nifty has been much faster than the down moves of last week.[/caption]
For now Nifty is in a corrective mode. Let us take a look at the chart. Notice that the up move of the Nifty has been much faster than the down moves of last week. On October 18, the index had a strong rally and for the past week prices have been coming down, but unable to wipe out the gains made on October 18. This essentially shows that the bull is still in control is just resting before making the next move.
We could see prices correct and come down the next support level before the next leg up. We feel that the next support level is between 6020 and 6070. This is a gap, which are essentially strong areas of support or resistance. A gap happens when the price closes at one level and then opens much higher or lower the next day. When prices open higher it shows extreme demand and if prices come back to the gap, there is usually a rally in price.
The support levels are marked by blue horizontal lines below current price. If that level is broken prices could go all the way down to 5900 to catch a bounce. The support level below that is in the range of 5660 to 5741.
Everything looks very bullish now, which sometimes is the time when the markets could turn. The fact that the Federal Reserve will keep printing money as the US economy is not showing signs of strength is a positive for the bull market. In addition the nomination of Janet Yellen and dove on monetary policy to take the place of Ben Bernanke is boosted the confidence in the market that easy money is here to stay longer than expected. But flip side is that the Fed may decided that easy money is loosing its effectiveness and begin tapering the bond buying program.
Skeptics of quantitative easing point to the recent fall in sales of Caterpillar the heavy equipment manufacturer as a sign that economy is slowing despite easy money. More such corporate results could result in a rigorous questioning of the efficacy of the quantitative easing policy. But till such time we will go by what the chart tells us and what we see is that the trend continues to be bullish. Hence we’d look for opportunities to buy.
The best option to buy is when Nifty hits the gap. The other option is to buy when the commodity channel index shown at the bottom of the chart hits zero. One also has the option to buy when the price hits the middle line of the bollinger bands. Now if three things happen at the same time - prices hit the gap, CCI hits zero and Nifty is at middle bollinger band, that will be a great buy.
George Albert is a Chicago-based trend watcher and edits www.capturetrends.com