
 "Nifty falters back to support, but don't expect a selloff")
The Nifty has fallen back to support once again, increasing the potential of a breakdown as the US equity indices fall below their uptrend lines. Both India and the US largely ignored the flood of money coming from Japan.
First, let’s take a quick look at Japan. The Bank of Japan announced a doubling of its bond purchases which will inject substantial liquidity into the global economy. Given the fact that the yen is freely convertible, the liquidity should ideally have pushed up global markets and not just Japanese equity indices. But that did not happen as poor services and manufacturing data from the US pulled both the American and Indian markets down. The Japanese Nikkei, however, had a huge run.
[caption id=“attachment_688773” align=“alignleft” width=“380”] We know that the Nikkei is not of much interest to Indian investors, but we want a make a point about the power of support and resistance levels. AFP[/caption]
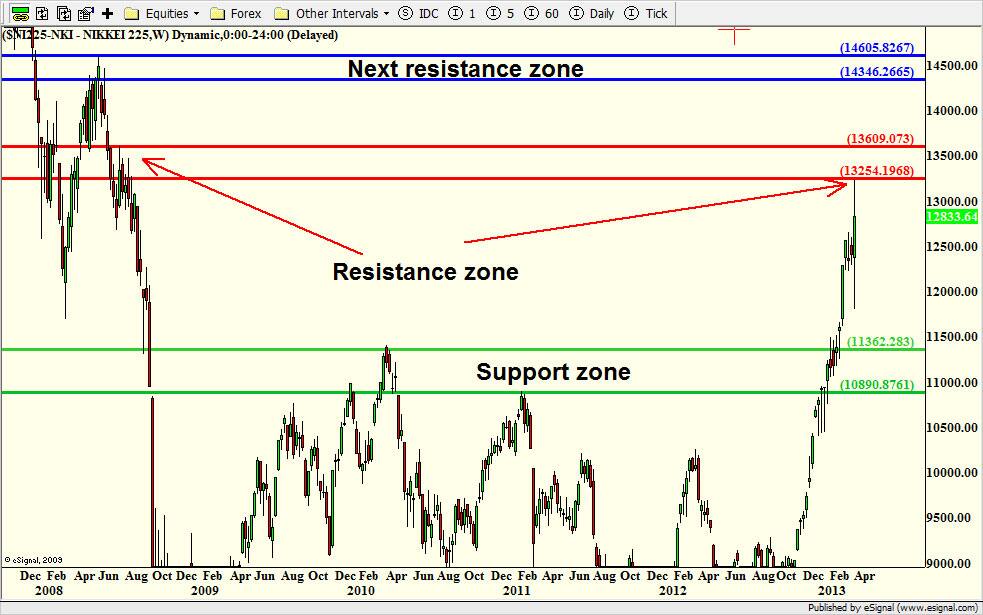
We know that the Nikkei is not of much interest to Indian investors, but we want a make a point about the power of support and resistance levels. Support areas are where the demand for a stock far exceeds supply, leading to a rally in price. Resistance levels are zones where there is excess supply of stock, leading to a drop in price.
A look at the Nikkei chart will show that prices fell from a consolidation area in 2008. (Click here for Nikkei chart) The area is shown by the red arrow on the left of the chart. Notice that after the Bank of Japan announcement, the index shot up to the 13,250 level, which was previous resistance, only to drop down to around 12,800, a near 450-point drop.
On the Nikkei, we’d be selling when prices reach the area marked by the red horizontal lines and buying if prices drop to the zone marked by the green horizontal lines. If the red zone is cleared, prices can go all the way up to the next resistance level marked by the blue horizontal lines.
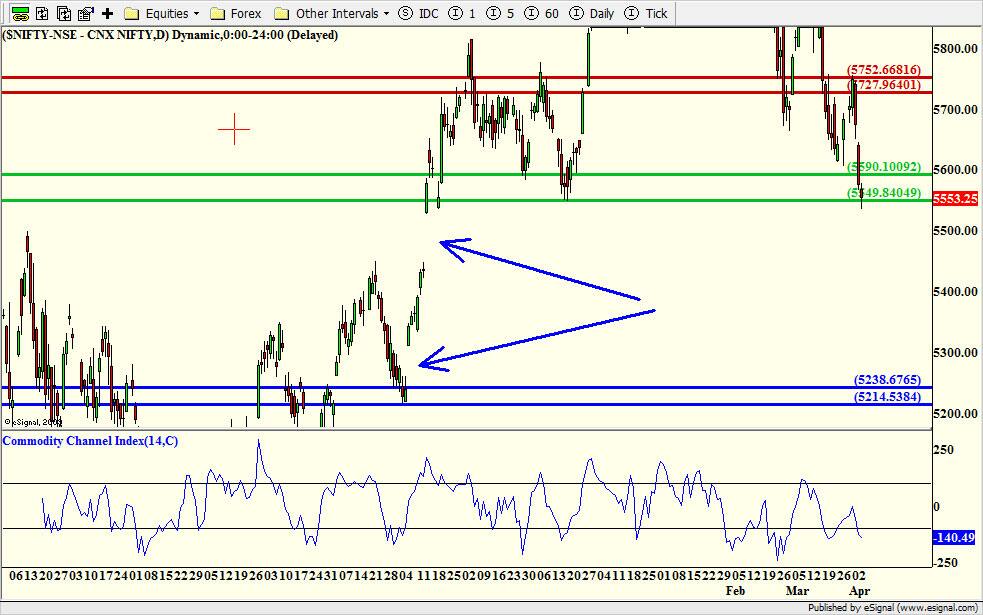
Nifty: The Indian index is clearly back at support. Like we said last week, the Nifty was at support and then rallied some. However, the index could not sustain the rise as the US indices fell on the back of bad economic numbers. Manufacturing and services sector growth slowed and the employment numbers also came in much lower than expected. That led to a three-day selloff in the US.
However, unless the Nifty closes below the support level, do not expect a selloff. The negative factor for the Nifty is that the US market had another selloff on Friday, increasing the chances that the Indian index could fall again. Also notice the blue arrows on the Nifty chart (Click here for Nifty chart). They show gaps. A price gap happens where there is extreme demand-supply imbalance, due to which the market which closes at one level opens much higher or lower the next trading day. These areas tend to act as magnets for price. So if the support level on the Nifty is broken we could see price come down into the gap.
On the positive side the Nifty has not broken support. Also notice the commodity channel index (CCI) at the bottom of the chart. Even though the Nifty has fallen to new lows the CCI has not. This shows some positive divergence between the CCI and Nifty. If the CCI, which is now at negative 140, goes above negative 100, it will be signal to buy.
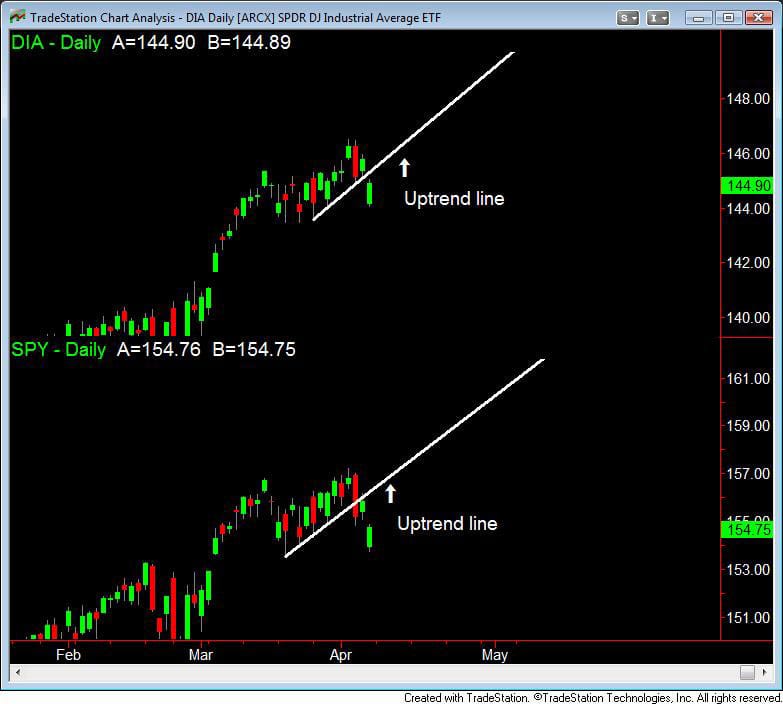
US markets: The US markets, which were on a steady uptrend, broke their uptrend line this month. (Click here to see the combined chart of Dow and S&P 500). DIA, which is the exchange traded fund (ETF) that tracks the Dow, is on the top of the chart and the S&P 500 ETF, SPY, is at the bottom of the chart. Notice the uptrend line in white and the prices are now below it. We could see a deeper correction in the US in the near future, which will affect the global markets.
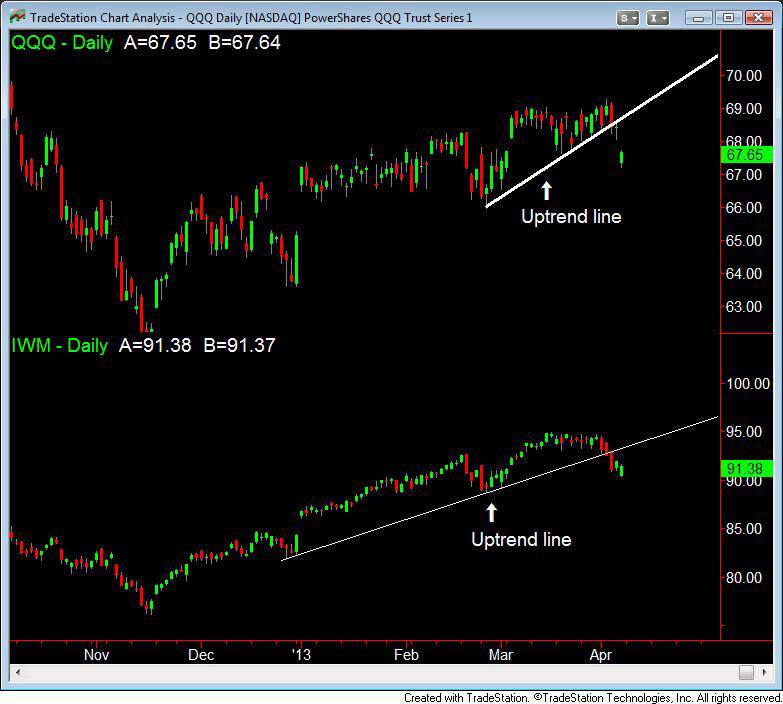
The same is true for the Nasdaq 100, composed of technology companies, and the Russel 2000, composed of small caps. (Click here for the combined chart of Nasdaq 100 and Russell 2000). QQQ, which is on top of the chart, tracks the Nasdaq 100, and the IWM at the bottom of the chart tracks the Russell 2000.
George Albert is Editor, www.capturetrends.com
 "Russian drones over Poland: Trump’s tepid reaction a wake-up call for Nato?")
 "As Russia pushes east, Ukraine faces mounting pressure to defend its heartland")
 "Why Mossad was not on board with Israel’s strike on Hamas in Qatar")
 "Turkey: Erdogan's police arrest opposition mayor Hasan Mutlu, dozens officials in corruption probe")


