
 "Nasdaq-Nifty link: Why you should watch Apple, Google shares")
By George Albert
Central banks and governments from China to Europe to the US have made comments on easing monetary policy and talk is expected to turn to action very soon. Why then is the market suddenly falling this week? Should the rally not continue?
The market faces a real hurdle which needs to be cleared for prices to rally. A determining factor of price direction is the direction of the leading and lagging markets. If the leader continues to rally it will take all the other indexes and stocks up with it. Once the leader hits resistance, the laggards take over, pulling all related assets down till support is hit.
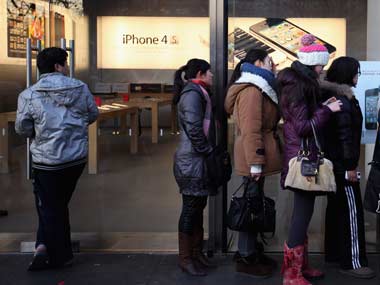
[caption id=“attachment_430071” align=“alignleft” width=“380”]  Apple and Google have a heavy weight in the Nasdaq index, so keep an eye on those two stocks. Getty Images[/caption]
Resistance levels are areas where the supply of an asset exceeds demand, leading to a fall in price. On the other hand, support levels areas where the demand for an asset exceeds supply leading to a rally in price.
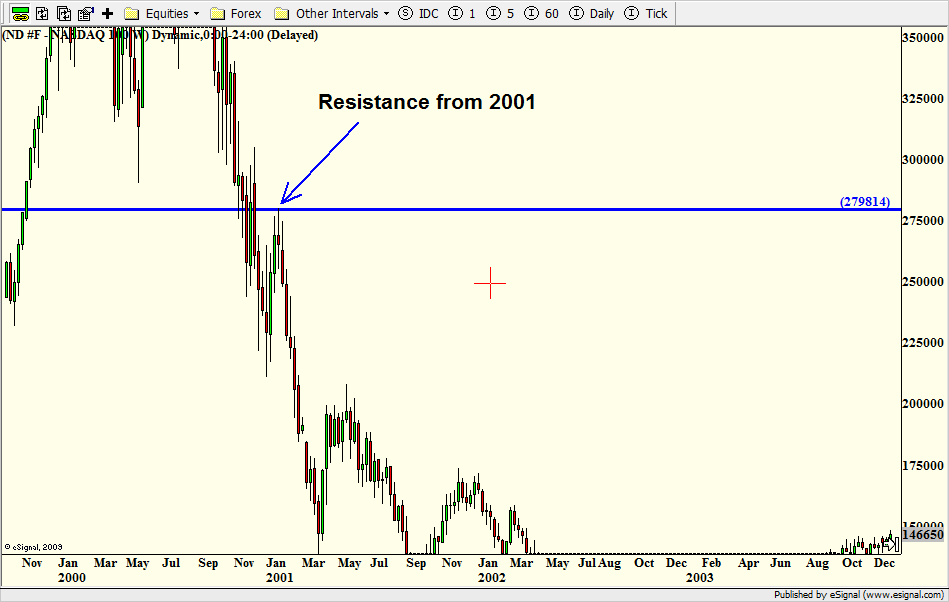
So what is leading globe equities? It’s the tech-heavy index, Nasdaq-100, which consists of the top 100 technology companies. The immediate question is why is Nasdaq-100 considered the strongest index? Let us look at the chart of the futures contract of the index **(** Click here for the chart ). Notice that price is now well above the 2007 peak of the market. None of the other indexes such as the S&P 500 and the Dow even reached their 2007 peak. Even the Nifty and Sensex did not cross their January 2008 peaks, even though it was touched in November 2010.
This clearly establishes that the Nasdaq 100 is the leading index that is pulling the markets up. Hence, when it hits resistance and the rally pauses, the bears take over. A look at the above chart will show that the index fell from the 2,800 level in April this year. (Please ignore the last to digits on the chart so the 279706 should really read as 2797), which is near the 2,800 level). Now prices are back to that level, but the level gains greater significance as it is the resistance level from the year 2001 as shown on the chart ( Click here for the resistance chart .) Notice that prices fell strongly from that level in 2001 and then fell again in April this year. We believe that the level from 2,800 to 3,000 is resistance and unless that zone is cleared we will not see a rally in the index and global equity markets.
Many times markets lose their leadership and if that happens to the Nasdaq then this correlation is out of the window. But till such time we will look at the Nasdaq for leadership. Note that Apple and Google have a heavy weight in the Nasdaq index, so keep an eye on those two stocks.
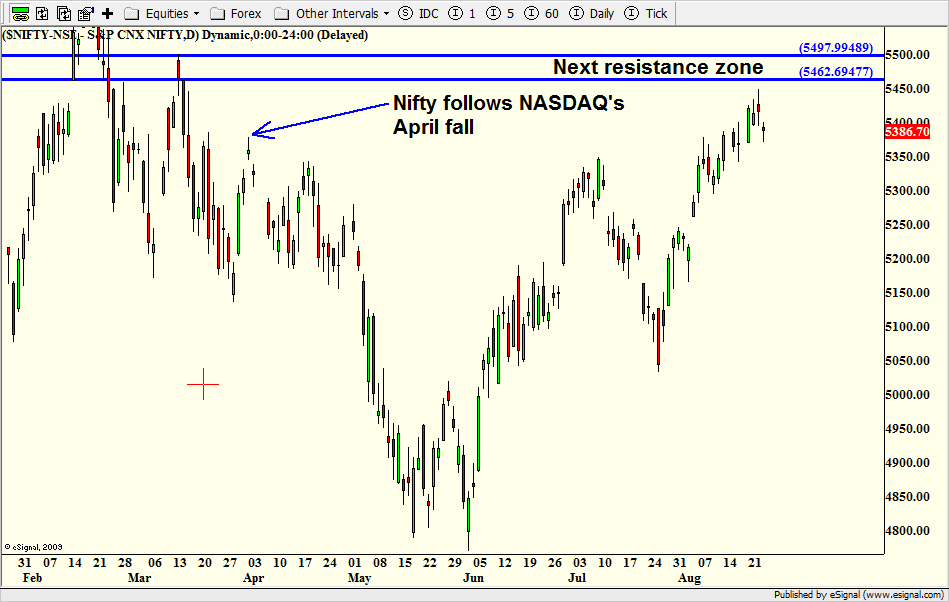
The following indexes don’t move in lock-step with the leaders but are greatly affected by it. Let us look at the Nifty ( Click here for Nifty chart ) study its correlation to Nasdaq. Notice that the Nifty began falling much before the Nasdaq fell in April 2012. However, after the Nasdaq fell in April the fall in Nifty accelerated. This clearly shows that the Nasdaq has an effect on the Nifty.
Now as the Nasdaq reaches resistance, bulls should be careful. A look at the Nifty chart also shows that the index is near a resistance zone too, as marked by the blue horizontal lines. If you are long, it’s time to book profits. Aggressive traders, on the other hand, can initiate short positions. However, if the Nifty closes above 5,500, exit the short positions.
It will be interesting to see what the central banks announce. On previous occasions, they have underwhelmed the market after building hype. If they do it again, we will see a fall in the equity market. Also, a common rule in the market is to buy the rumor and sell the news. Hence unless central banks blow away market expectations one could see a fall in the markets.
George Albert is Editor, www.capturetrends.com
 "Israel targets top Hamas leaders in Doha; Qatar, Iran condemn strike as violation of sovereignty")
 "Nepal: Oli to continue until new PM is sworn in, nation on edge as all branches of govt torched")
 "Who is CP Radhakrishnan, India's next vice-president?")
 "Israel informed US ahead of strikes on Hamas leaders in Doha, says White House")


](https://images.firstpost.com/wp-content/uploads/2012/08/Apple_Asia_GettyImages.jpg)