
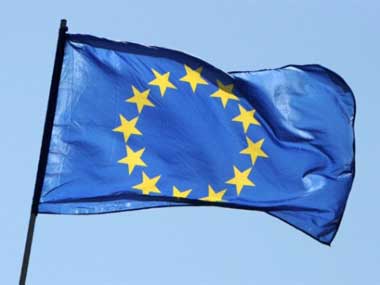
 "EU's sugar rush peps stocks, but it's a bit late to join the party")
The news out of the European Union provided a boost to risk assets and beat down safe havens such as the US dollar, but it may be a bit late to jump into the party right now. There is a little more upside in some markets, after which asset prices face hurdles.
The most important news out of Europe is that the zone’s bailout funds, the European Financial Stability Facility (EFSF) and the European Stability Mechanism (ESM), can directly capitalise banks. Earlier the funds had to go through the governments to the banks, which made the fiscal deficits of the countries look worse. The other news was that the funds to recapitalise Spanish banks would not be treated as debt senior to the Spanish government’s.
These new agreements by EU countries will not make the books of the PIIGS (Portugal, Ireland, Italy, Greece and Spain) look worse if they avail themselves of the bailout funds. But this is just window dressing. The first thing to happen is that the balance-sheets of the stronger countries like Germany will take on more risk when the funds provided to weak country banks are not senior to the sovereign. This essentially means that the bad apples in Europe can now spoil the good apples.
[caption id=“attachment_362530” align=“alignleft” width=“380” caption=“The success of the new EU agreement will depend on the details of triggers and penalties if the PIIGS go off track again. AFP”]  [/caption]
However, the success of the new EU agreement will depend on the details of triggers and penalties if the PIIGS go off track again. That discussion could turn the markets volatile in the coming days. But remember that so far the markets have not seen the PIIGS punished strongly enough for missing targets. What the market has seen is that the strong countries rush to the rescue at the 11th hour. This vicious cycle of indiscipline and lack of consequences will eventually create a huge problem, but for now the equity markets and risk assets are rejoicing.
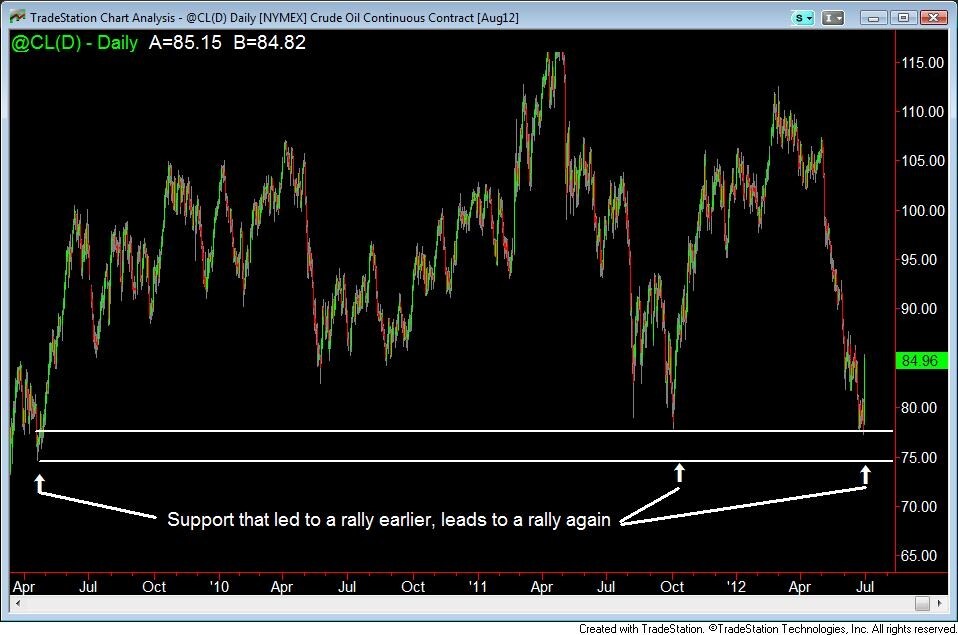
Oil - A lesson in inflation
The markets began to rise last Thursday in the US after news of the EU agreement began to trickle in. On Friday, equity markets all over the globe went ballistic. But the market that takes the cake is oil. Crude oil traded on the Nymex rose by more than 8 percent after the EU announcement. ( Click here for chart )
This a perfect example of throwing cash at the symptoms and not resolving the core problem - which is no good. The problem in the EU is sluggish growth in the private sector which is not able to sustain the large government sector. The goal should be to grow the private sector to increase tax revenues and shrink the government to cut expenses. This will increase the supply of goods and services and keep a lid on prices.
By throwing cash at the problem by way of bailouts, the EU is increasing money in circulation. This only leads to asset price bubbles, as shown by the rally in oil, which eventually leads to inflation. So even before the cash trickles down to the common man, prices have already shot up.
Incidentally, in technical terms, oil rallied from an area of support, as shown on the chart. Support areas are where demand for an asset exceeds supply, leading to a rally in price.
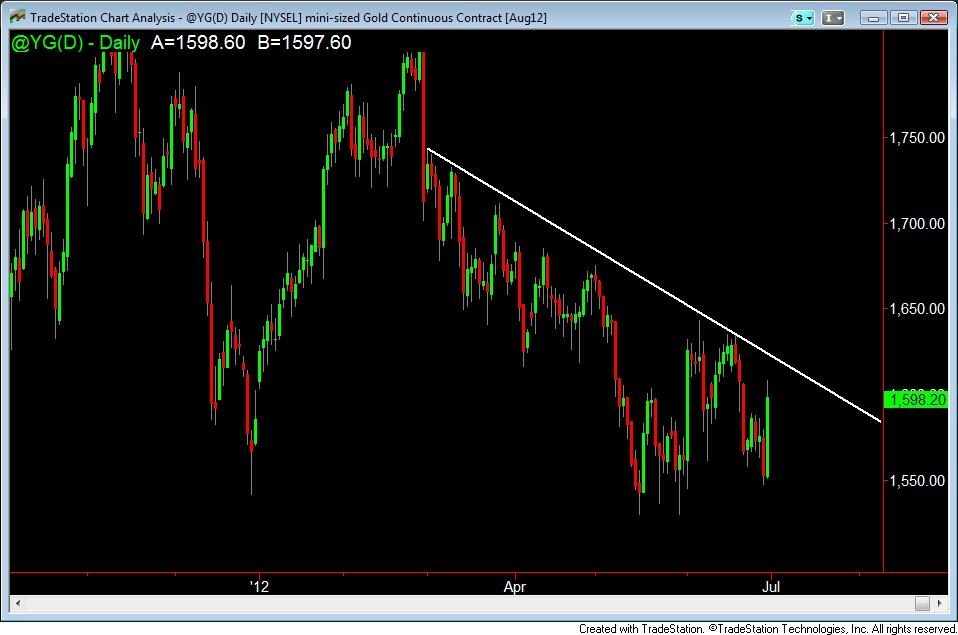
Gold downtrend still intact
The rally in the equity market has not led to a break in the downtrend of gold ( Click here for Gold chart ). Notice that gold is still below the downtrend line shown in white. Unless the trend line is broken, gold will not rally strongly. So gold bugs should wait for the trend line to be broken before turning bullish. However, the price action in gold shows a higher likelihood of an upside breakout as lately the green candles are longer and stronger than red candles, showing strong buying interest.
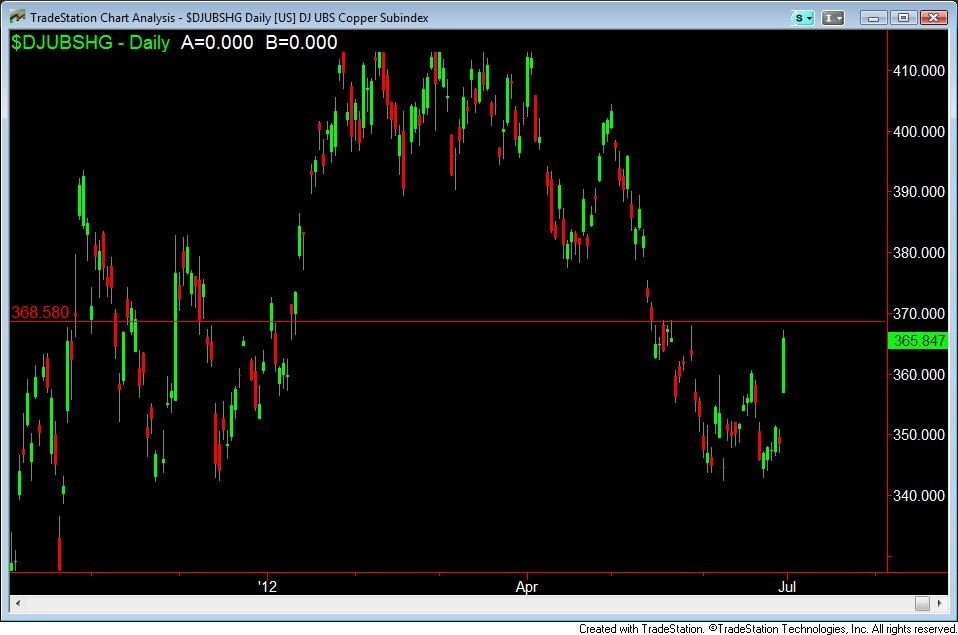
Copper’s strength leads to selloff point
Copper had a strong rally, but is near a resistance area, as shown by the red line on the chart ( Click here for copper chart ). Copper has to break out and continue to rally for the equity rally to be sustained. Now is not the time to buy copper; wait for the breakout before turning bullish. Copper often leads the equity market, as we have mentioned many times before in this column. Notice that all of this week, when the global equity markets were all over the place, copper was slowly rising.
If copper has a strong selloff from resistance, the equity markets are highly likely to follow.
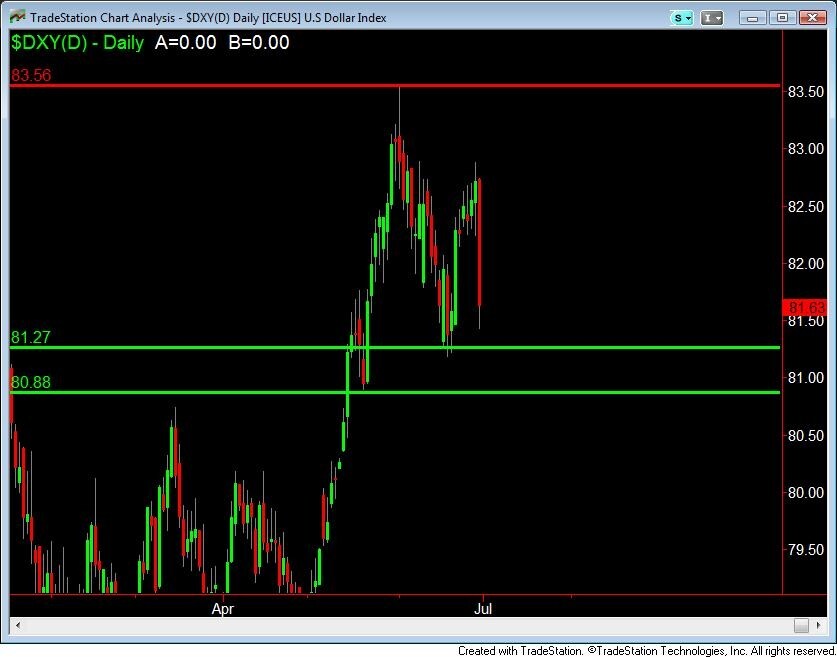
Dollar index near rally points
The dollar and equities are inversely related. Hence when the dollar rallies, equities sell off. The dollar is a safe haven play and equities a risk play. When risk appetite increases, like it did on Thursday and Friday, equities rallied and the dollar sold off.
However notice that the dollar index ( Click here for dollar index chart ) has reached an area of support from where it had rallied earlier. There are two areas of support shown by the green lines. The dollar index has to close below these levels to go lower and for the equity markets to rally.
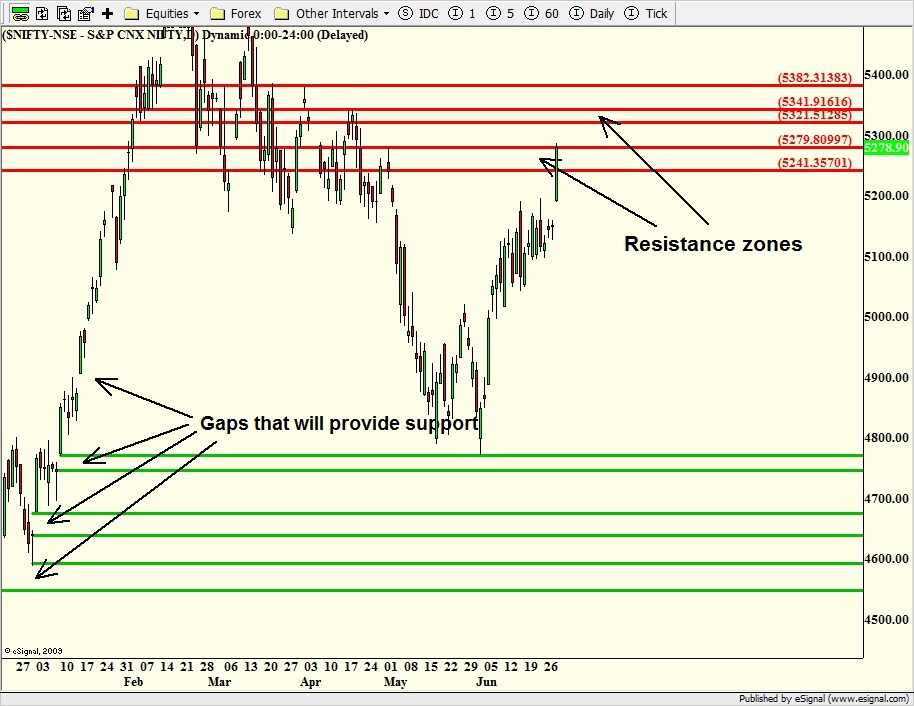
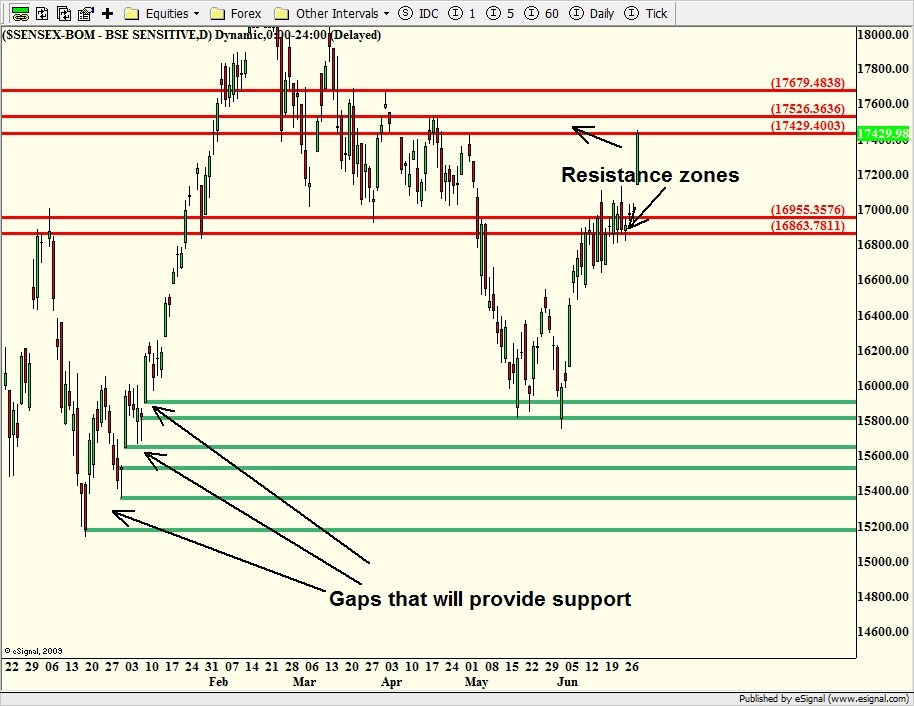
Nifty and Sensex
Just as the dollar index nears support, the Nifty and Sensex are near key resistance zones (Click here for Nifty and Sensex charts). Prices often fall from resistance as supply of stocks at those levels exceeds demand. Nifty and Sensex are already in one of their resistance zones, which needs to be cleared to reach the next level.
Since there is not much of an upside on both the indexes, it’s best to take short-term trades. Aggressive traders can short at the resistance zones with stops a little above the zones.
George Albert is Editor, www.capturetrends.com
 "Israel targets top Hamas leaders in Doha; Qatar, Iran condemn strike as violation of sovereignty")
 "Nepal: Oli to continue until new PM is sworn in, nation on edge as all branches of govt torched")
 "Who is CP Radhakrishnan, India's next vice-president?")
 "Israel informed US ahead of strikes on Hamas leaders in Doha, says White House")


](https://images.firstpost.com/wp-content/uploads/2012/06/EUflag-afp.jpg)