
 "Equity bounce depends on dollar fall, copper revival")
The US dollar rally paused in the week to 8 June as prices hit a previous selloff point, reducing the appetite for safe havens. This led to a rally in the equity markets. Unless the dollar sells off a continuation of the equity rally is in doubt.
Additionally, the leading indicator of the equity markets - copper - is not showing signs of strength. Copper is a barometer of economic strength and usually rallies before the equity markets. Even though the Sensex in India and the Dow in the US rallied strongly last week, copper did not, casting doubts on the strength of the bulls.
The market threw many traders off balance. After a selloff in the week before, many bears anticipated a further fall in the trading week to 8 June. That, however, did not happen, as the market rallied. A majority of analysts attributed the rally in the early part of the week to the expected stimulus from central banks, which could possibly be the reason. But one never knows for sure why the millions of traders buy or sell on any given day.
For instance, when European Central Bank did not ease interest rates, the European markets fell. But so did the China markets despite cutting rates. The US markets, on the other hand, rallied at the end of the week despite the Federal Reserve chairman not making any statements about more quantitative easing in his testimony before Congress.
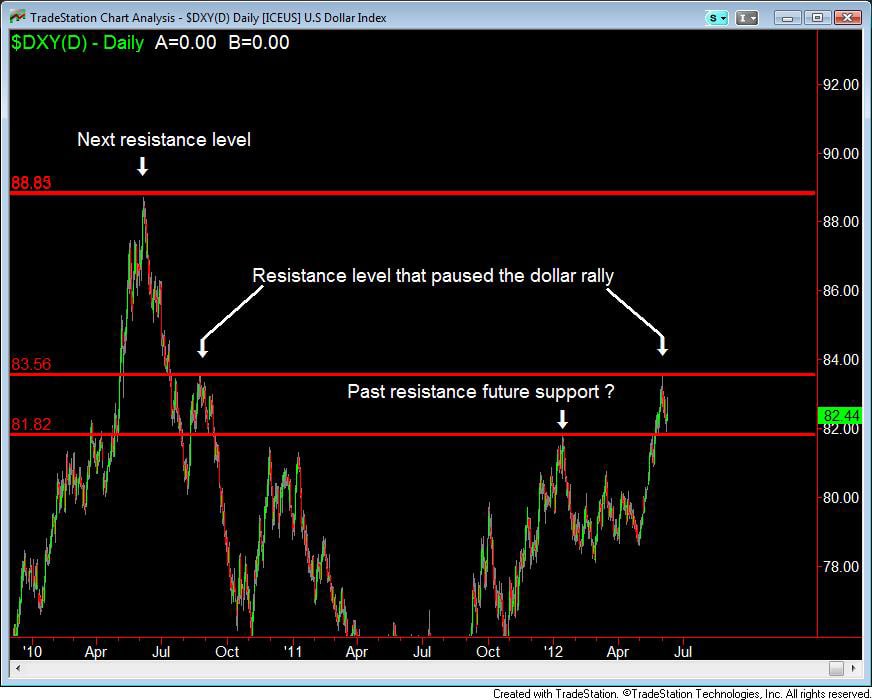
Readers of this column, however, would have anticipated the pause in the equity selloff for three reasons: the dollar hitting resistance, the Sensex not breaking support and lack of strength in copper prices. We have spoken about the inverse relationship between the dollar and equities. A look at the dollar index chart ( Click here for chart) shows that prices hit resistance last week. We had marked these resistance levels in previous articles. Prices often turn lower from resistance, which increases the possibility of an equity rally given the inverse dollar-equity relationship.
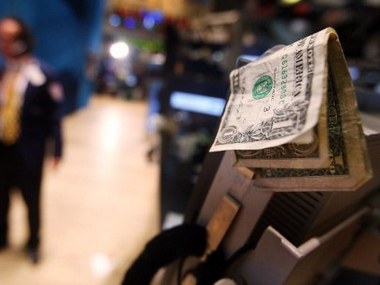
[caption id=“attachment_337610” align=“alignleft” width=“380” caption=“The dollar is a safe haven and equities are considered a risk play. Hence when the appetite for risk increases, the value of safe havens falls. AFP”]  [/caption]
The dollar is a safe haven and equities are considered a risk play. Hence when the appetite for risk increases, the value of safe havens falls.
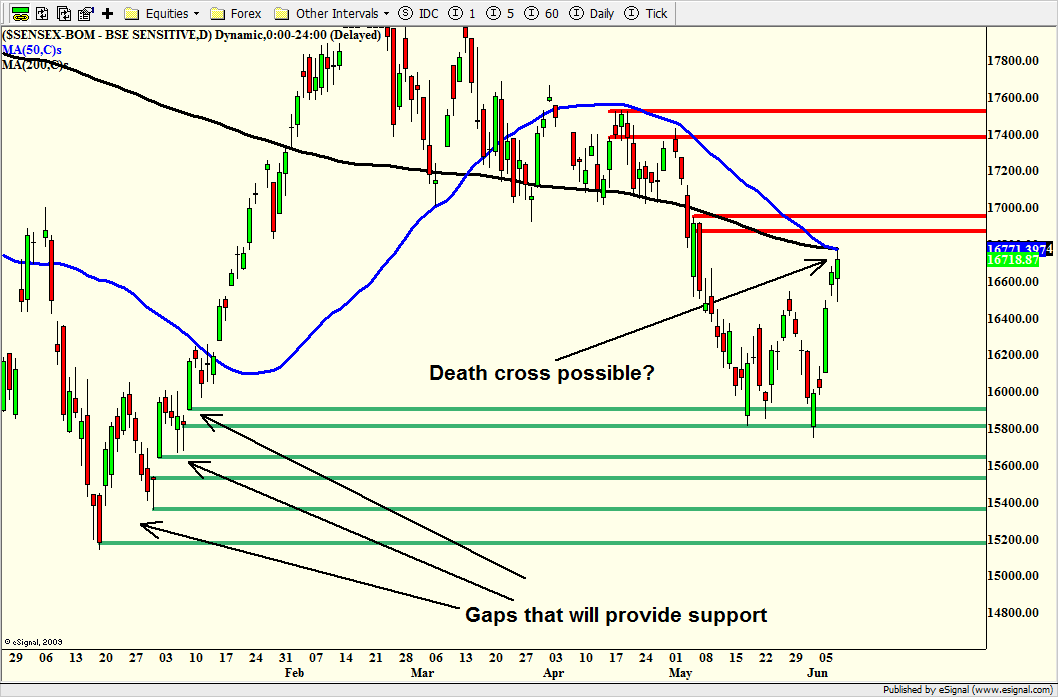
Along with the dollar index hitting resistance the Sensex and even the US equity markets hit support. We had mentioned in previous articles that unless the Sensex closed below its gap support level the market would not go lower. Prices often turn higher from support levels as the demand for stocks exceeds supply. In the final analysis, demand and supply always determine price levels. A look at the Sensex chart ( See sensex chart ) shows that the index rallied from the gap support level shown by the green lines.
Finally, a look at the prices of copper shows that even though the equity markets rallied, copper refused to follow. Copper often leads the equity markets up. Copper is considered a leading indicator of the equity market as the metal shows the health of the economy. The relationship between copper, the equity market and economy has worked many times.
Copper is used in most manufacturing processes and a fall in copper prices shows a drop in demand for the metal. This suggests that manufacturers don’t need the metal as they foresee a slowdown in their business. As manufacturing decelerates, so does the economy. Since the stock markets discount the future, they tend to fall a little after copper prices fall, and vise versa, in a bullish scenario.
In fact, in December 2008, copper stopped falling and began to rally. However, the equity markets began to rally only a few months later in March 2009. Again, in February 2011, copper had begun falling, but the S&P 500 continued to rally and fell strongly a few months later.
Looking ahead
So will the Sensex continue to rally? Like we said last week a cut in interest rates by the Reserve Bank may do the trick. However, the charts show many hurdles for the bulls. First, copper is not showing strength. Second, the Sensex faces a few resistance levels higher up, which are shown by the red lines on the chart. Also note that the death-cross almost happened this week and prices are near the crossing level. For more on the death cross, please read last week's article.
Finally, one has see if the appetite for risk is back on the table and that will be shown by the dollar index. The dollar index is now trapped in a narrow zone of a support level at 81.82 and a resistance level at 83.56. Unless the index closes below 81.82, a further rally in equities seems difficult. And even below 81.82, there is another support level of 81. These levels have to be cleared for a sustained rally in equities.
On the other hand, if the dollar index rallies above 83.56 it will be bad news for equities.
George Albert is Editor, www.capturetrends.com
 "Israel targets top Hamas leaders in Doha; Qatar, Iran condemn strike as violation of sovereignty")
 "Nepal: Oli to continue until new PM is sworn in, nation on edge as all branches of govt torched")
 "Who is CP Radhakrishnan, India's next vice-president?")
 "Israel informed US ahead of strikes on Hamas leaders in Doha, says White House")


](https://images.firstpost.com/wp-content/uploads/2012/06/dollar-afp.jpg)