 "Don't count on Nifty bounce; index is in resistance zone")
The Nifty bounced off the support mentioned in last week’s article and has now reached a level of resistance, which could lead to a pause in the rally or even a selloff. Most interestingly, the index has closed above its 200-day moving average.
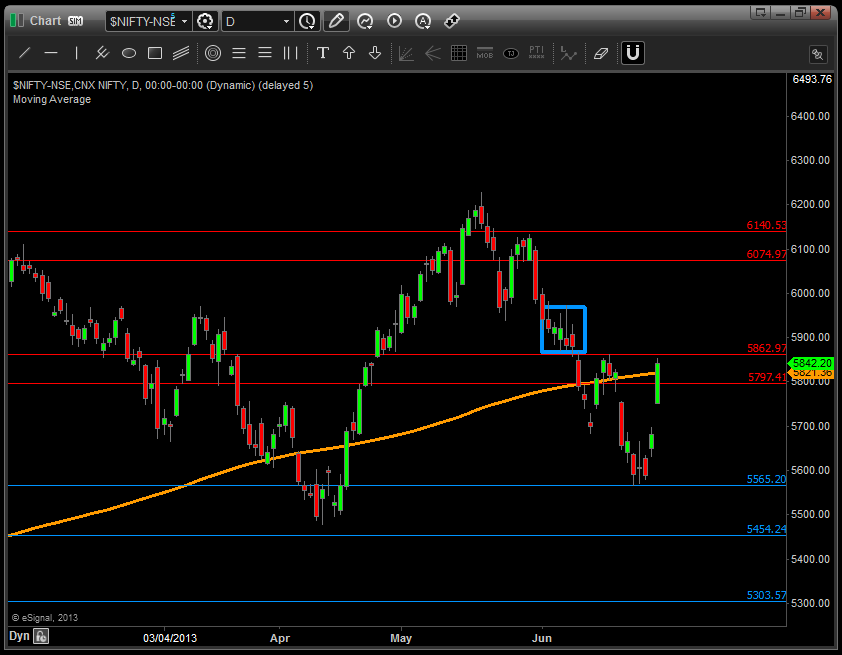
Support levels are areas where demand exceeds supply, leading to a rally in price, and resistance levels are areas of excess supply causing a fall in prices. Let us take a look at the chart of the Nifty to analyse its price action ( See Nifty chart ). Notice that prices bounced off support levels that we had marked on the chart last week. The support levels are shown by the two horizontal blue lines.
[caption id=“attachment_915297” align=“alignleft” width=“380”] Reuters[/caption]
However, in the last two trading days, prices have rallied straight into a resistance zone, as shown by the red horizontal lines. In that resistance zone is also the 200-day simple moving average (SMA), which strengthens the resistance zone a little more. The 200-day is shown by the orange up-sloping line. If the 200 SMA sloped was down, it would have provided a much stronger resistance level. Up-sloping moving averages show a bullish trend and hence do not act as strong resistance. Another sign favouring the bulls is Friday’s close above the 200 SMA.
But the chart shows resistance in price, which could slow or reverse the uptrend of the past two days. Also notice the blue square above the resistance zone. Prices moved sideways for a few days there before they fell, which again is the hallmark of an oversupply zone. This is another resistance zone that puts downward pressure on price. In case the price rallies above the area shown by the blue box, we could see the index go up to the next resistance zone shown by the red lines.
Right now we’d not be going long as prices are at resistance. The time to go long was when prices were at the demand zone that we had marked on the charts last week. Aggressive traders could short the Nifty now as prices are at resistance. However, since the resistance area goes as high as the top of the blue box, which is 5,975, the supply zone is very wide. This means that shorting now needs a big stop-loss to give the index enough wiggle room so that you are not kicked out of the trade, before the market takes a plunge.
A conservative stance would be to wait for the index to go deeper into the resistance zone before shorting. This not only narrows your stop-loss, but also increases your profit potential as you’d sell at a higher price. The downside to this approach is that prices may never go higher and sell off from Friday’s closing level. An aggressive trader should have had a limit order to short at the resistance zone before markets opened on Friday, which would have been filled once price hit the supply zone.
In the month of June, the index has made lower lows and lower highs, which is a medium-term bearish trend. The lower lows are shown by the white arrows and the lower highs by the red ones. A lower low is when the latest price is lower than the previous recent low. A lower high is when the latest high in price is lower than the previous recent high. Even though the long-term trend as shown by the up-trending 200-day SMA is bullish, the medium term is bearish. Trend changes always begin in the short- and medium-term charts before showing up on the long term charts.
Now if the index makes a higher high, then the medium-term bearish signal of lower highs and lower lows is no longer valid. After Friday’s price action, the index is very close to making a higher high.
The bulls have momentum on their side, given the rapid rally in price. Let’s see what the market does next week, but remember price is at resistance and hence not a time to buy if you are a rules-based trader.
George Albert is a Chicago-based trend watcher and edits www.capturetrends.com