
 "Correction or rally? The jury is out on Nifty, Bank Index")
Special to Firstpost
CNX Nifty (5,983.55): The price action in the Nifty in the last trading week was in line with expectations. As observed in the chart posted a couple of weeks ago, the Nifty reversed right off the then mentioned upper trend-line. (The updated chart is posted below). The target of 6,220-6,240 was also achieved during the week gone by. It remains to be seen if the swing low at 5,970 is protected by the bullish camp.
[caption id=“attachment_815227” align=“alignleft” width=“620”]  The updated chart.[/caption]
The prior top at 6,110 is the reference point for the bearish camp. Any failure to get past the 6,110 level would indicate that the index is getting into a deeper correction. This could open up downsides extending to 5,850 and even 5,600.
[caption id=“attachment_815233” align=“alignleft” width=“380”] 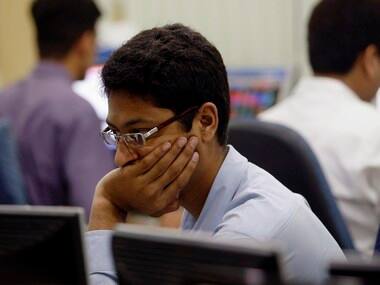 Is it correction or rally at Nifty? The jury is out. Reuters.[/caption]
But, if the Nifty is strong enough to get past 6,110, then it would be reasonable to expect a rally to new highs. As always, it makes sense from a trading perspective to let the price give us the clue about its intention rather than second guessing the direction of the next big move.
Stocks such as United Spirits, MRF, TCS and Bata India come across as prime candidates to be included in the long-term portfolio. Any weakness in these stocks may be viewed as an opportunity to buy.
Bank Index (12,769.35): The price action in the CNX Bank Index does not provide concrete signs of the next big swing. What the index does near the key resistance at 12,950-13,100 would provide insights into what is in store. Inability to get past 13,100 would suggest a major swing failure that could push the index to lower levels.
A push above the 13,100 mark would mean that the index has resumed its medium-term uptrend and the earlier view of a rally to 13,750 would gain currency then. Fresh exposures to the banking sector may be put on hold until there is clarity about what the index does at 13,100. A fall below 12,200 would strengthen the case for a deep downward correction that could extend up to 11,350-11,450.
**IDFC (Rs 156.20):**The stock has been moving within a nice trend channel and has taken support at the lower end of the channel last week. This is a sign that the buyers are interested at lower levels. The short-term outlook is bullish and a rally to Rs 175 appears likely.
Investors may buy the stock with a stop-loss at Rs 147, for a target of Rs 175. A breakout past Rs 175 could trigger a rally to Rs.181. Those having a bit of patience may get exit opportunities at Rs 181 and beyond.
Tata Steel (Rs 313.90):The stock has been in a sharp downtrend for several months now. The price action in the past few weeks indicates that the stock has been consolidating near key support at Rs 290-300 levels.
[caption id=“attachment_815229” align=“alignleft” width=“620”] 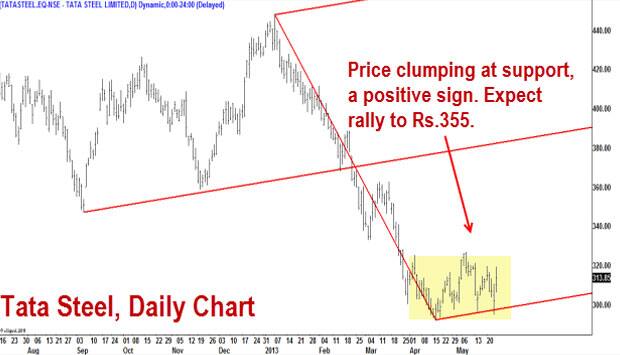 Chart for Tata Steel.[/caption]
Investors may buy the stock with a stock with a stop-loss at Rs 290 for a target of Rs 355. A breakout past Rs 355 would be a sign of strength and would also lend momentum to the uptrend. The stock could then rally to the major resistance at Rs 380.
(The views and recommendations featured in this column are based on a technical analysis of historical price action. There is a risk of loss in trading. The author may have positions and trading interest in the instruments featured in the column.)
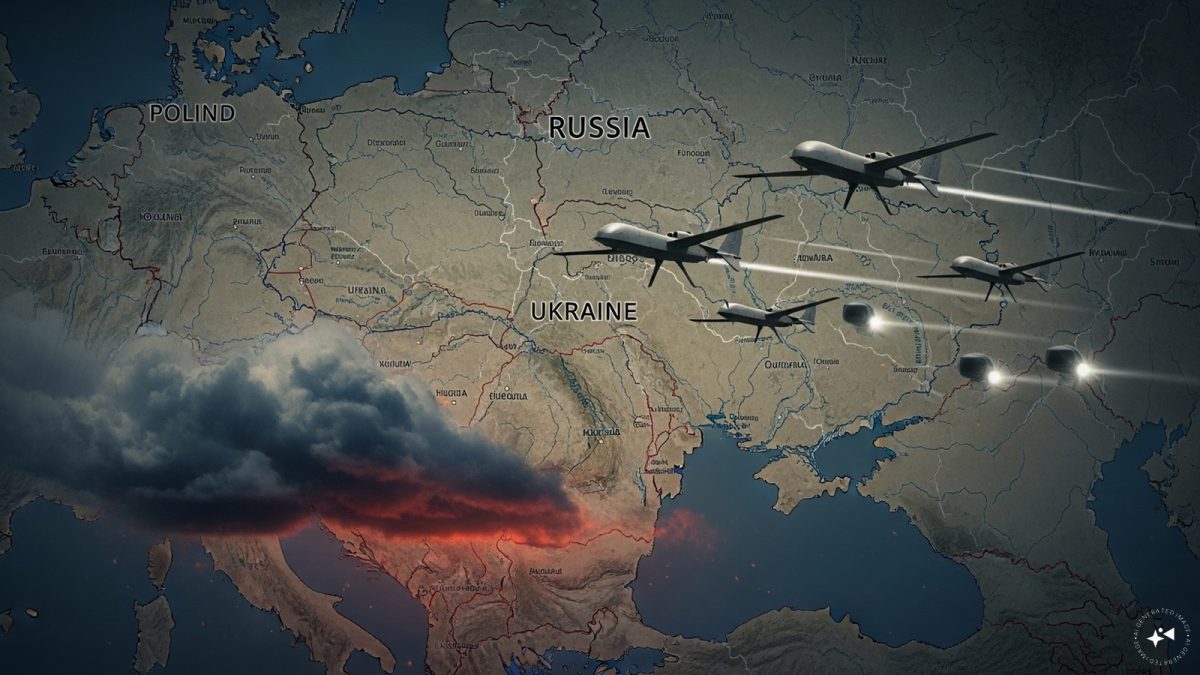 "Russian drones over Poland: Trump’s tepid reaction a wake-up call for Nato?")
 "As Russia pushes east, Ukraine faces mounting pressure to defend its heartland")
 "Why Mossad was not on board with Israel’s strike on Hamas in Qatar")
 "Turkey: Erdogan's police arrest opposition mayor Hasan Mutlu, dozens officials in corruption probe")
 "Russian drones over Poland: Trump’s tepid reaction a wake-up call for Nato?")
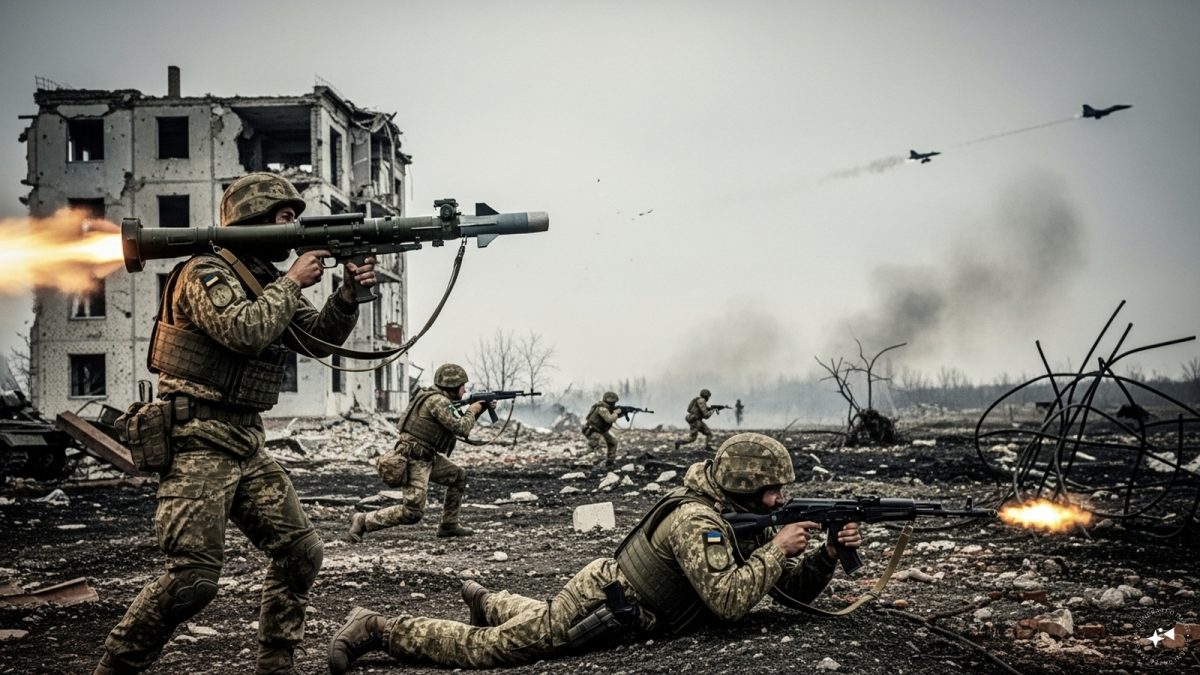 "As Russia pushes east, Ukraine faces mounting pressure to defend its heartland")
 "Why Mossad was not on board with Israel’s strike on Hamas in Qatar")
 "Turkey: Erdogan's police arrest opposition mayor Hasan Mutlu, dozens officials in corruption probe")


