 "Chart: Is the worst over for Nifty?")
Special to Firstpost
CNX Nifty (5,783.10): The index moved in line with expectations. As anticipated, the index saw a healthy recovery and also almost hit the target of 5,800 mentioned last week. The sharp crack in gold price along with the weakness in the international price of crude oil helped prop domestic stock market sentiment.
As highlighted in the daily chart above, the index is now perched below the next resistance at 5,810-5,820 range. The more significant resistance is at 5,960-5,980 range. A breakout past 5,980 would indicate that the worst is over for the Nifty.
While the index is headed towards multiple resistance levels, there are no signs of weakness as yet. The momentum behind the up move last week was quite strong and there is no reason to suspect the continuation of the recovery process.
[caption id=“attachment_715118” align=“alignleft” width=“380”] A fall below 5,590 would be a sign of weakness and would suggest resumption of the medium term downtrend.[/caption]
A fall below 5,590 would be a sign of weakness and would suggest resumption of the medium term downtrend. Rather than second guessing if the uptrend will continue or not, it would make sense to await clues from price.
The support level at 5,590 and resistance at 5,980 are the key markers that traders would be interested in. A breakout past either of these levels would set the tone for the next big move in the index.
Bank Index (12,288.25): This index played a pivotal role in propelling the Nifty to higher levels last week. The rally last week has pushed the index closer to the major resistance at 12,550. A breakout past this level would be a strong signal that the index has resumed its long term uptrend.
A fall below 11,400 would indicate that the index is still in a medium-term downtrend and could seek lower levels. At the moment, there are no signs of a reversal of the recent upside recovery. A failure to move above 12,550 would be an early forewarning that the index is headed to lower levels.
The price action over the next few weeks would therefore be crucial and would throw up clue about the near term direction. For the moment, 12,550 and 11,400 are the levels to keep a tab on.
Titan Industries (Rs.259.15): After a sustained downward correction, the recent price action suggests that the fall has been arrested and a short-term uptrend is underway. The recent chart pattern indicates that the stock could rally to the immediate resistance at Rs.285.
[caption id=“attachment_715120” align=“alignleft” width=“600”]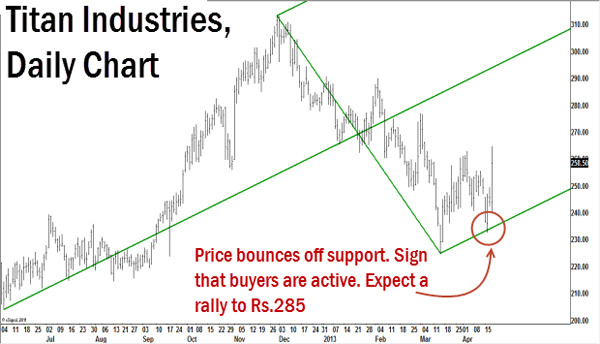 Chart two[/caption]
Long position may be considered with a stop loss at Rs235 and target of Rs 285. A breakout past the primary resistance at Rs 285 could trigger a rally to the major resistance at Rs 295.
Century Textiles (Rs.299.35): The stock has been in a major downward correction over the past several months. The price action in the past few days indicates that the stock could seek higher levels in the short-term.
Use price weakness to buy the stock with a stop loss at Rs 262, for an initial target of Rs 335. Investors willing to play the waiting game may get exit opportunities at or above 355.
(The views and recommendations featured in this column are based on the technical analysis of historical price action. There is a risk of loss in trading. The author may have positions and trading interest in the instruments featured in the column.)