Mumbai Indians became the second team to defend the IPL title after Chennai Super Kings with win over Delhi Capitals by five wickets on Tuesday. This was the fifth time that Mumbai Indians won an IPL title. This was also the sixth time that Rohit Sharma won an IPL final as a player. Mumbai Indians were the only outlier in the tournament and rightly so as they defeated all the teams at least once in the tournament. Let’s look at their dominance with the help of the following dashboards. IPL 2020 - Batting stats Mumbai Indians completely dominated the tournament with six of their batsmen scoring 250-plus runs. Four of those six batsmen hit more than 20 sixes in IPL 2020. Five out of those six had a strike rate of 140-plus in the tournament. [caption id=“attachment_9011461” align=“alignnone” width=“640”]
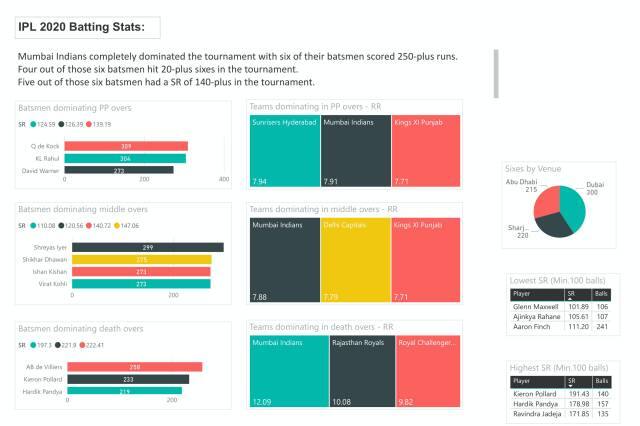 MI were second best in powerplay overs in IPL 2020 and topped the charts in the middle and death overs. Image: Stats/Umang Pabari[/caption] [caption id=“attachment_9011431” align=“alignnone” width=“640”]
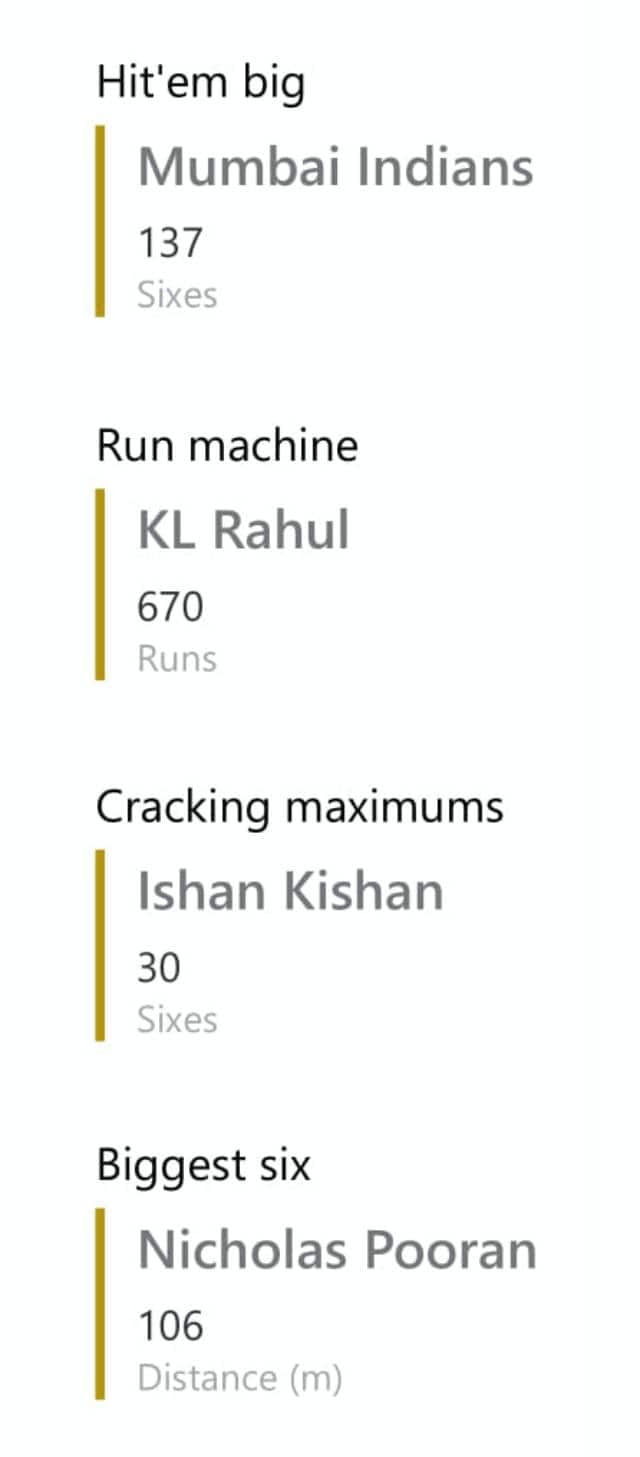 Mumbai Indians hit a staggering 137 sixes in the entire IPL 2020. Image: Stats/Umang Pabari[/caption] IPL 2020 - Bowling stats Mumbai Indians pacers Trent Boult and Jasprit Bumrah took 52 wickets between them. MI topped the powerplay overs and death overs with best economy rate in each phase. [caption id=“attachment_9011441” align=“alignnone” width=“640”]
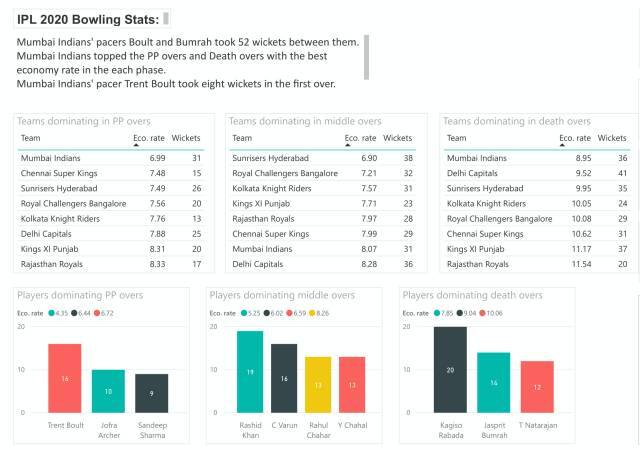 MI dominated with the ball at the start of an opponent’s innings and at the death. Image: Stats/Umang Pabari[/caption] [caption id=“attachment_9011451” align=“alignnone” width=“640”]
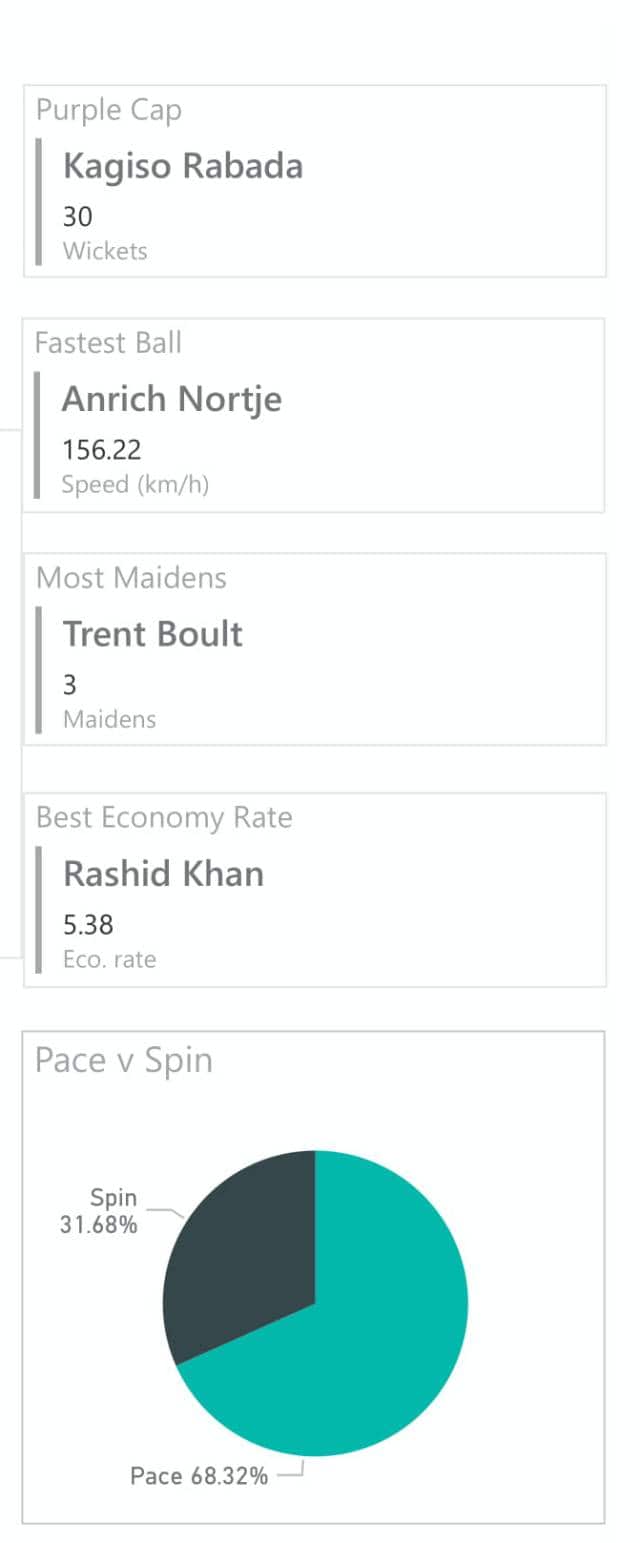 Kagiso Rabada of Delhi Capitals took the Purple Cap in IPL 2020. Image: Stats/Umang Pabari[/caption] Mumbai Indians’ pacer Trent Boult took eight wickets in the first over.
IPL 2020 Stats review: MI's lethal seamers, equal show with the bat help clinch fifth-title
Umang Pabari
• November 13, 2020, 11:14:50 IST
Mumbai Indians completely dominated the tournament with six of their batsmen scoring 250-plus runs.
Advertisement
 "IPL 2020 Stats review: MI's lethal seamers, equal show with the bat help clinch fifth-title")
End of Article