
 "With high GDP growth, Modinomics works without compromising on fiscal discipline or inflation, argues BJP economist")
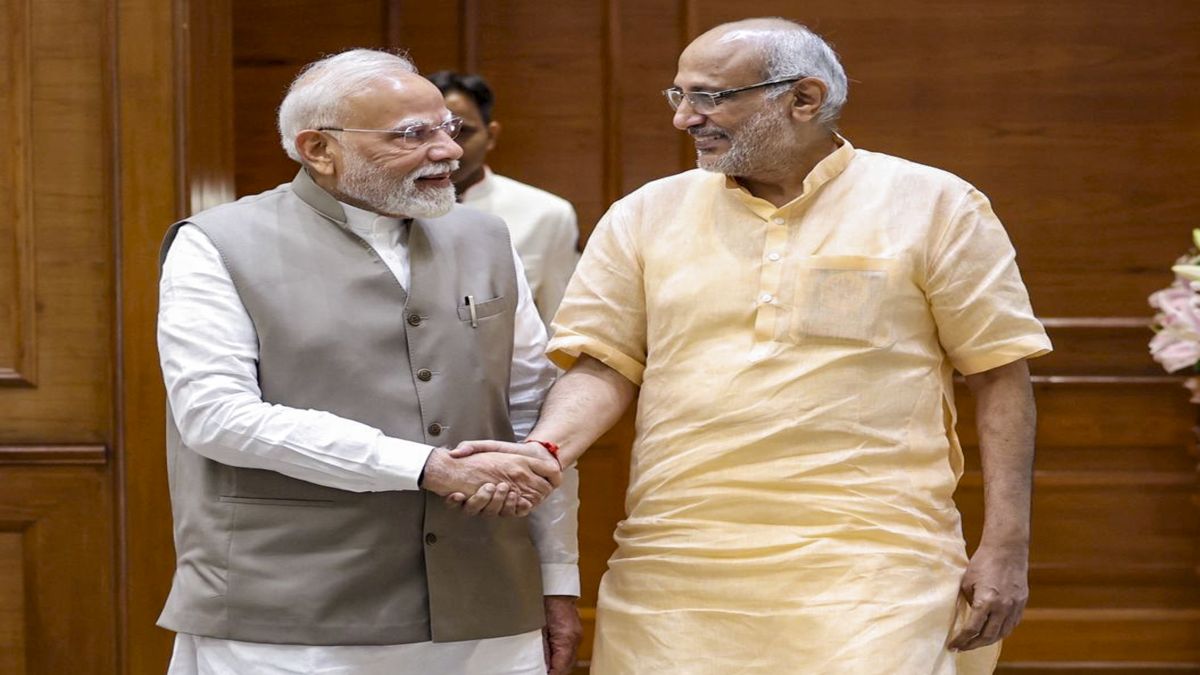
In January 2015, the Central Statistical Organisation (CSO) shifted to a new GDP series (the base year 2011-12) with a different methodology and in November 2018, it released the back series estimates for the years 2005-06 to 2013-14. As per this updated series, the Gross Domestic Product (GDP) growth under the Congress-led United Progressive Alliance (UPA), for a ten-year period from 2004-05 to 2013-14, was barely 6.7 percent, or so. In effect, contrary to popular belief, it is amply clear now that the UPA dispensation, under Manmohan Singh, presided over what can be termed as India’s lost decade. The lowest GDP performance ever recorded in the last 15 odd years is now an abysmal 3.1 percent in 2008-09, lower than even the earlier estimated level of 3.9 percent. It is only in the fifth year in 2018-19, that the GDP slowed a tad to 6.8 percent. Despite that, the first term of the Narendra Modi government still clocked an average of over 7.3 percent, toppling France as the 6th largest economy in the world in 2018 and en route to replacing the United Kingdom as the 5th largest economy globally, this year. While the ten-year UPA era GDP growth was sub 7 percent, under the present government, the GDP growth has been within arm’s reach of almost 8 percent, with the CSO estimating the real GDP at constant (2011-12) prices, to have come in at Rs 141 lakh crore in 2018-19. The real GDP at constant (2011-12) prices, post the latest revisions for 2016-17 and 2017-18, likewise stand at Rs 122.98 lakh crore and Rs 131.80 lakh crore, respectively. [caption id=“attachment_6790051” align=“alignleft” width=“380”] File image of Prime Minister Narendra Modi. ANI[/caption] Further, the addition to GDP at current market prices during 2014-2019 is higher by over 2.8 percent, than in 2009-2014. India’s nominal GDP grew by Rs 59 lakh crore in 2009-2014, but with high inflation, in double digits, under a moribund Congress-led UPA-2. In sharp contrast, under the National Democratic Alliance (NDA), the nominal GDP grew by a far higher at Rs 76 lakh crore and more, between 2014-19, but with much lower inflation, averaging at barely a little over 4 percent. Even the fiscal deficit that was largely over 5 percent under UPA-1 and 2, was reined in at well under 4 percent by the NDA, without compromising growth. The recent statements by the ex-CEA, Arvind Subramanian, who said the GDP growth was at least 2.5 percent lower in some years in the last 5 odd years without any supportive data, but purely backed by conjecture, has only added more fuel to the raging GDP debate. That the ex-CEA is wrong in downgrading India’s GDP numbers and the revised methodology, is established in this piece, with pointed rebuttals. The GDP growth under the last two years of UPA-2 stands at 5.5 percent and 6.4 percent, for 2012-13 and 2013-14, respectively, post-back series announced in November 2018. Before proceeding any further, readers would do well to note that the Congress has maintained silence on the fact that it was only thanks to the new methodology adopted by the Modi government, that the last 2 years of UPA-2 saw the GDP numbers being revised upwards, failing which, the average GDP growth for 2012-13 and 2013-14, under the UPA-2, would have actually been well below 5 percent, under the old methodology. However, even based on the conservative November 2018 updated back series data, the 7.4 percent odd GDP growth recorded between 2014-15 and 2017-18, under the first fout years of the NDA, is much higher than that of the UPA-2 era, for a similar period. What has come as a welcome development is the fact that the GDP growth in the fourth quarter of 2017-18 and the first quarter of 2018-19, have been a resounding 7.7 percent and 8.2 percent, belying all expectations. Unlike several times in the past, when the base-year had been changed, with no protests or even a meek squeak from relevant stakeholders in 1970-71, 1980-81, 1993-94, 1998-1999 and 2004-05, the new base year adoption of 2011-12 by the NDA government, was met with protests from several sections of the intelligentia and the Opposition. The protests are meaningless, as the new series has undergone changes which are aligned with the International Monetary Fund (IMF) and the UN system of accounts, in line with global best practices. In most developed countries including the US, the base year is in fact, changed virtually every single year and they follow what is called a “rolling base year”. Hence, if the government rightfully changed the base year for GDP estimation from 2004-05 to 2011-12, why the brouhaha? For example, since the new GDP revision represents the value addition in goods, it eliminates redundant goods and makes way for commodities currently under production. For instance, when computers replaced typewriters, the latter were taken out of the new updated back series calculation. Similarly, in the communication sector, minutes of usage was adopted for calculations instead of subscriber growth, in the earlier series. It should be noted that the findings by the Sudipto Mundle committee, which the Opposition and Modi’s critics have been harping on, as it portrayed the GDP under the UPA era in bright light, were never authentic conclusions, backed by hard data. Mundle is himself on record stating that the GDP exercise undertaken by him was merely an academic one and more in the nature of academic findings that were not conclusive in nature, due to several limitations. And hence, the new inclusive back series GDP numbers with 2011-12 as the base year jointly released by the CSO and NITI Aayog in November 2018 are the numbers that truly matter and these numbers backed by logic and data prove that the 1st term of Modi has been the best, both in terms of quantum and quality of GDP growth in the last 15 years. [caption id=“attachment_4289093” align=“alignnone” width=“1280”]
 Representational image. Reuters[/caption] Coming back to the Mundle committee, it seems to have clearly overestimated the growth in trade, hotels, transport and communication (THTC), during UPA-1. This gross anomaly is evident from the fact that in real terms, THTC growth was between 14.9 percent and 5.7 percent or an average of 9.1 percent per year under UPA-1. However, as per the Mundle committee calculations, the real THTC growth in UPA-1 was between 22.8 percent and 5.7 percent or an average of 17.1 percent per annum. Just ponder over it – no data point, past or present has even been able to support the fact that Wholesale and Retail Trade (WRT) grew at 17 percent per annum under UPA-1. The difference between the old numbers based on 2004-05 as base year, and new numbers by Mundle committee, was a disproportionately high extra 8 percent growth in THTC in each year of UPA-I; given that THTC accounted for 18 percent of GDP, that extra 8 percent wrongfully worked out to an extra growth of 18.8 percent or 1.4 percent per annum, under UPA-1, as many have pointed out and this is where Mundle seems to have gone off track. Correcting for this deviation, the updated GDP back series of November 2018 brings down by 1.4 percent the average GDP growth under UPA-1 from the earlier 8 percent, on this metric of THTC alone. The moot point and harsh reality are that GDP growth under UPA-1 was pretty dismal. Also, while re-doing the GDP exercise, often, the way a commodity is used, could change. This alters the final outcome. The thing is when one is doing such an exercise, one should remember that we all have the same sets of goods and services, though we don’t have the prices of those goods and services. Plus, the ways in which we are using different commodities also change over a period of time. The things which were more important 5 or 10 or 15 years back may become less important, or what was less important may become more relevant now. So, when one is revising the GDP numbers, we have to use those proxies or combinations that best interpret the evolving consumption and investment patterns in an economy and that is precisely what the updated GDP series announced in November 2018 by the Modi dispensation has sought to do. For instance, one such reinterpretation of data is for the telecom space. Here, the latest GDP series by the Modi government has taken into consideration the usage or minutes of use of telecom services in place of the number of subscribers that was used earlier. For telecom, earlier the number of subscribers was considered. Now it has changed to the number of minutes used. In effect, earlier the voice traffic or phone calls by the telecom subscriber base was a key reference point, but now, as everyone would agree, the growth in data usage and data traffic has been humungous, so it is only fair that this change in composition from voice to data and the very manner in which the telecom space has evolved, is rightfully captured. And that is precisely what the reconstruction of the GDP with 2011-12 as the base year, has sought to achieve. The 2011-12 base year takes into account additional and important changes in various sectors, particularly the changes related to manufacturing. Also, for instance, between 2004-05 and 2011-12, financial services data have undergone a drastic change because the banking sector has seen a growth explosion with an array of banking products which is reflected in the solid credit offtake numbers in retail loans, housing loans, personal loans and vehicle loans, even when the overall credit growth may have been relatively softer in the given years. Former Chief Statistician TCA Anant has said on record that since mining output was linked to trade under the old series data (with 2004-05 as the base year, which the UPA regime used for computation), a boom in mining, followed by a bust after 2010-11, when restrictions were imposed by several states, tended to exaggerate the picture of expansion earlier. This had to be corrected, which the Modi government did. Asked about the growth rates for the UPA era estimated by the Mundle panel earlier, current Chief Statistician Pravin Srivastava asserted that statistically, the new estimates with 2011-12 as the base year far better capture the country’s economic performance for earlier years. Interestingly, under the new series, GDP in the last 2 years of UPA-2 has been upgraded from 4.7 percent to 5.5 percent for 2012-13 and from 5 percent to 6.4 percent for 2013-14, again falsifying claims by the Congress that the GDP numbers have been distorted deliberately by the Modi government, to paint a poor picture of the UPA days. Had there been any political agenda, the Modi government could have downgraded the GDP numbers for the aforesaid years. The CSO said the divergence between old GDP numbers with 2004-05 as the base year and the new updated version with 2011-12 as the base year, is on account of recalibration of the economy with the latest data sets. Also, in the mining and quarrying sector, regular annual returns of the public sector have been used, instead of the Indian Bureau of Mines data, used earlier.
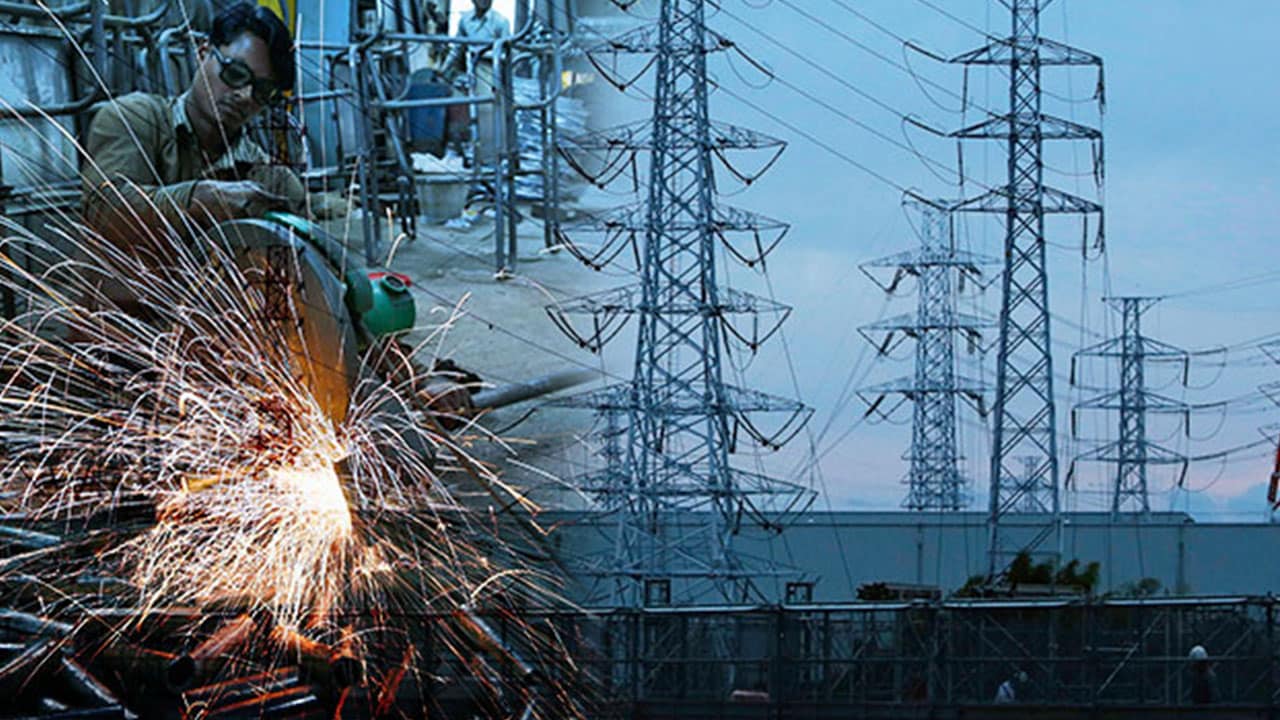
The share of the secondary sector in total GVA, too, has increased in the new series, compared with the 2004-05 series. The increase is largely due to the use of new Ministry of Corporate Affairs (MCA-21) data and public sector data in the organised electricity and manufacturing sectors, which was earlier sourced from annual reports of private electricity companies registered with the Central Electricity Authority and Annual Survey of Industries respectively, as per the CSO.
However, the share of the tertiary sector in overall GVA has reduced in the new series with 2011-12 as the base year, compared with the 2004-05 series, used by the Congress-led UPA. This decrease is largely on account of the use of revised methodology and the latest survey data sources of the unorganised sector in the new base. In the 2004-05 base, the main data sources for the unorganised sector were the NSS informal sector survey of 1999-2000 for the trade sector, unorganised enterprise survey results of NSS 63rd round (2006-07) for the remaining non-financial service sectors, and the Employment and Unemployment Survey (EUS) of NSS 61st round (2004-05). In the 2011-12 base, the main data source for the unorganised non-financial service sector has been the result of the unorganised enterprise survey of NSS 67th round (2010-11) and the NSS 68th round (201112). In effect, the new GDP series showed a lower contribution in the tertiary sector comprising ‘trade, repairs, hotels, restaurants, transport, storage, communication and financial services’, in overall growth rates. Based on the 2004-05 series, the share of the tertiary sector in Gross Value Added (GVA) was 5.8 percent in 2005-06, which dropped to 4.3 percent, as per the 2011-12 series. The CSO attributed the lower share of the tertiary sector to several factors such as usage of sales tax index and new series of WPI inflation, as against the Gross Trading Income index. It is needless to add, therefore, that the new GDP series with 2011-12 as the base year,which uses more comprehensive MCA-21 data,versus say the earlier data based on Annual Survey of Industries (ASI), is more representative about not only the broader and emerging changes in the composition of the Indian economy over the last few years, but is also more accurate, as it relies on data that is more updated, authentic and verifiable. The Congress and other Opposition parties have raised a hue and cry on the new GDP numbers only because they clearly show that growth under former Prime Minister Manmohan Singh was sub-par. Is it normal for divergence in numbers between GDP and GVA? Is the Opposition crying foul only because the GDP growth under the Modi dispensation is far higher than the UPA regime?
Usually, GDP is higher than GVA as the former includes indirect tax collections as well. However, the GDP was lower than GVA in 2006-07, 2008-10, and 2011-12. In fact, a possible reason for this could be the fertiliser subsidy which was scaled up significantly from 2005-06 onwards, following poor agricultural growth, though the attendant benefits were not enough due to political mismanagement by the UPA, which is, however, a different subject altogether. Also, during this period, net indirect tax collections grew by only 6.5 percent, possibly due to the higher subsidy burden, whereas normally, indirect tax revenue growth is between 2-2.5 times higher than the GDP growth number, if not more. The point to be noted here is, there are no set norms.
Economics is an asymmetrical science and those who accuse the Modi government of changing the GDP methodology need to realise that there have been umpteen instances in the past under the UPA dispensation wherein established co-relation between GDP and other related parameters have moved in different directions. For instance, as per 2004-05 as the base year, the divergence between GDP and GVA has been the highest ever in 2010-11, with GDP higher than GVA, by a massive 301 basis points. It was due to a huge 83 percent jump in subsidies which momentarily pushed up growth but at the exorbitant cost of pushing up inflation too. Even the mirage of high growth in 2010-11 could not be sustained in the following years by a thoroughly corrupt Congress-led UPA-2 as the impact of the fiscal stimulus began to wear off. Digressing a bit, it is worth mentioning here that even during the erstwhile UPA regime, the GDP numbers have been revised. The GDP growth number was lowered by the Central Statistics Office (CSO) to 3.5 percent from earlier estimates of 5.9 percent in the fourth quarter of 2008-09. On the flip side, in the fourth quarter of 2009-10, the GDP growth was upgraded to 11.2 percent versus 9.4 percent earlier. It is amply clear now that revisions in the GDP numbers have happened regularly, even during erstwhile Congress-led dispensations and to single out the Modi government for a routine revision in line with global best practices is hypocrisy. While the GVA gives a picture of the state of economic activity from the producers’ side or supply side, the GDP figure projects the consumers’ side or demand perspective, and under the Modi government, both GDP and GVA have fared exceedingly well. That said, the brightest news on this front has to be the fact that CSO estimates the per capita income in real terms (at 2011-12 prices) during 2018-19 to attain a likely level of Rs 92,718 from Rs 87,623 in 2017-18. The Modi era has reportedly seen a 45 percent jump in per capita income in absolute terms, between 2014 and 2018, which is the best measure of the fact that the fruits of higher GDP growth have percolated down to just about everyone, changing the structure of the traditional “income pyramid”. Needless to add, Modinomics with consistently high GDP growth has come in without compromising on fiscal discipline, or inflation, or Current Account Deficit (CAD). CAD, for instance, stood at a dangerous 4.8 percent in the December 2013 quarter but under Modi’s 1st term, has averaged at well below 2.5 percent. A report in January 2019, released by Standard Chartered Bank, says that based on the Purchasing Power Parity (PPP) by 2030 at $46.3 trillion, India is likely to become larger than the US in terms of GDP, and just behind China with roughly 77 percent of the Indian population being 44 years of age or lower, with India’s overall consumption alone being at $5.7 trillion annually. Clearly, Modinomics has laid the foundations for India’s entry into the super league of nations, in terms of economic dominance, in the decades ahead. A temporary blip in auto sales due to BS-VI emission norms that have to be complied with by 2020, is being used by Modi naysayers to allege that the economy is falling off a cliff without telling people that auto sales in the US, the UK, Germany, Japan and China have been declining due to the impending new norms. As for Arvind Subramanian, the GDP proxies used by him do not account for agriculture that constitutes over a sixth of India’s economy, nor do they give due weightage to services, which as a sector, accounts for well over 50 percent of India’s GDP. That India has been the fastest growing economy in the world in the last 5 years is documented by the likes of IMF and World Bank and to assume otherwise based on mere guesstimates to grind an old axe after demitting office is a bad counsel. (The writer is an economist and chief spokesperson of the BJP, Mumbai)

 "Israel targets top Hamas leaders in Doha; Qatar, Iran condemn strike as violation of sovereignty")
 "Nepal: Oli to continue until new PM is sworn in, nation on edge as all branches of govt torched")
 "Who is CP Radhakrishnan, India's next vice-president?")
 "Israel informed US ahead of strikes on Hamas leaders in Doha, says White House")


