LinkedIn is giving a boost to its publishing platform – where people write and share blog posts – with analytics. The social network for working professionals has started to roll out analytics and statistics on posts made on its publishing platform, allowing authors to better track traffic that their posts receive. “With more than 360 million profiles, LinkedIn is the place you want to be to share your expertise and to discuss issues that matter to you with other like-minded professionals. But, how do you know what is resonating and who is listening to what you have to say? How are you reaching them?”
LinkedIn wrote in a blog post
.
Who’s viewed your post? LinkedIn’s publishing platform gets analytics boost
FP Staff
• May 8, 2015, 14:55:00 IST
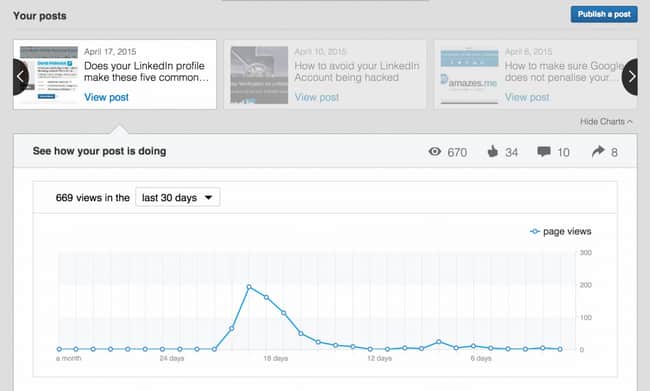
The new analytics toolset helps users choose any of their past posts to look at, with stats going back up to six months on the view graph.
Advertisement
 "Who’s viewed your post? LinkedIn’s publishing platform gets analytics boost")
“We’re excited to introduce analytics for publishing on LinkedIn as a new way to answer these questions. Analytics for publishing on LinkedIn provides insights into who’s reading and engaging with your posts. With this knowledge, you’ll be able to evaluate whether you’re reaching the right audience, which posts are resonating with readers, and more,” LinkedIn added. The new analytics toolset helps users choose any of their past posts to look at, with stats going back up to six months on the view graph. “You can see a performance summary of views, likes, comments and shares, and scrolling further down the page, see which LinkedIn members have viewed, liked, commented and shared,” said David Petherick, a marketing professional who also happens to be a frequent publisher on LinkedIn. There are also further demographic break-downs based on those who are reading as logged-in LinkedIn users covering areas like industry, location and even job title. Users can see where traffic is being driven from, and more.
End of Article