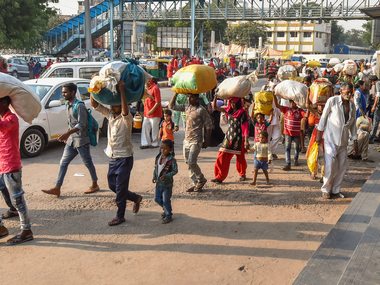
Ever since it was first introduced in the 1990s, Human development index or HDI has become the preferred indicator to gauge a country’s socio-economic progress. The United Nations Development Program (UNDP) describes HDI as an indicator emphasising that “people and their capabilities should be the ultimate criteria for assessing the development of a country, not economic growth alone.” In short, while the economic growth is necessary for development, it is only a means to that process but not an end in itself. The UNDP states that one can use the HDI to critically examine policy choices in different countries with a similar range of per-capita income but varied levels of human development. The index is the geometric mean of three categories of human achievements: Life expectancy at birth, educational attainment and Gross National Income per capita. Educational attainment is further divided into two subsections: Average years of education for adults over the age of 25 and average years of expected education for children entering school. [caption id=“attachment_5347031” align=“alignleft” width=“380”] Representational image. PTI[/caption] The Gross National Income (GNI) per capita, which is adjusted to purchasing power parity, measures the standard of living in a country. The GNI is the total domestic and foreign output claimed by residents of a country, excluding income earned in the domestic economy by non-residents. How is HDI calculated 1) Life Expectancy Index (LEI) = LE-20/85-20 LEI is 1 when Life expectancy at birth is 85 and 0 when Life expectancy at birth is 20. 2) Education Index (EI) = MYSI + EYSI/2 MYSI stands for Mean Years of Schooling while EYSI stands Expected Years of Schooling. 2.1) Mean Years of Schooling Index (MYSI) = MYS/15 Fifteen is the projected maximum of this indicator for 2025. 2.2) Expected Years of Schooling Index (EYSI) = EYS/18 Eighteen is equivalent to achieving a master’s degree in most countries. 3) Income Index (II) = In (GNIpc) - 1n(100)/In (75,000) - In(100) II is 1 when GNI per capita is $75,000 and 0 when GNI per capita is $100. The scores of the three categories are then aggregated into a composite index using geometric mean. The UNDP has been using the geometric mean method since 2010 in order to nullify the advantage of achieving a higher HDI by performing well in one dimension but lagging in the other two. “The geometric mean reduces the level of substitutability between dimensions and at the same time ensures that a 1 percent decline in the index of, say, life expectancy has the same impact on the HDI as a 1 percent decline in the education or income index”, states the UN body. Limitations of HDI The HDI fails to show the wide discrepancies within a country. The index also reflects long-term changes but fails to account for the short-term improvements. The problem of averages also catches up with HDI. Just because the GNI per capita is higher in the index does not necessarily translate into better welfare and a higher standard of living. Inequality-adjusted HDI Recently, the UNDP began calculating the HDI by adjusting the indies to the apparent inequalities within each country. This means that there is no uniform distribution of human achievements within a country itself. Example: In the context of India, Kerala boasts of the highest HDI while Bihar comes last in the list. This means that the two states may have the same average HDI yet experience regional inequality in the distribution of human achievements. To overcome the problem, the UNDP utilises Anthony Barnes Atkinson’s family of inequality measures. It is computed as the geometric mean of the three indices adjusted for inequality. The inequality in each dimension is estimated by the Atkinson inequality measure, which is based on the assumption that a society has a certain level of aversion to inequality. India and the world According to the latest UNDP figures, India’s HDI figure stands at 0.640. With that HDI, India ranks 130th in the world. However, India’s overall HDI figure has steadily improved in the last three decades. In 1990, India’s HDI figure stood at 0.427. While India performs better in the life expectancy index, with a score of 0.751, it performs poorly in GNI per capital index, scoring just 0.627. The score is even lower in the education index – 0.556. In the Inequality-adjusted HDI, India scores a dismal 0.468. Norway has the highest HDI with a score of 0.953. The Scandinavian country is followed by Switzerland (0.944), Australia (0.939), Ireland (0.938) and Germany (0.936).
Follow full coverage of Union Budget 2019-20 here
The UNDP states that one can use the HDI to critically examine policy choices in different countries with a similar range of per-capita income but varied levels of human development.
Advertisement
End of Article


)

)
)
)
)
)
)
)
)


