 "Slideshow: How India's economy performed under NDA, UPA governments")
[caption id=“attachment_80550” align=“alignnone” width=“860”]
 In the lead up to the 2014 elections, India’s economic growth is at a ten-year low, industrial production is down and the surfacing of multiple scams has led to the ongoing slump. These slides show how various economic barometers performed under previous Indian governments, going back to the early 90s.
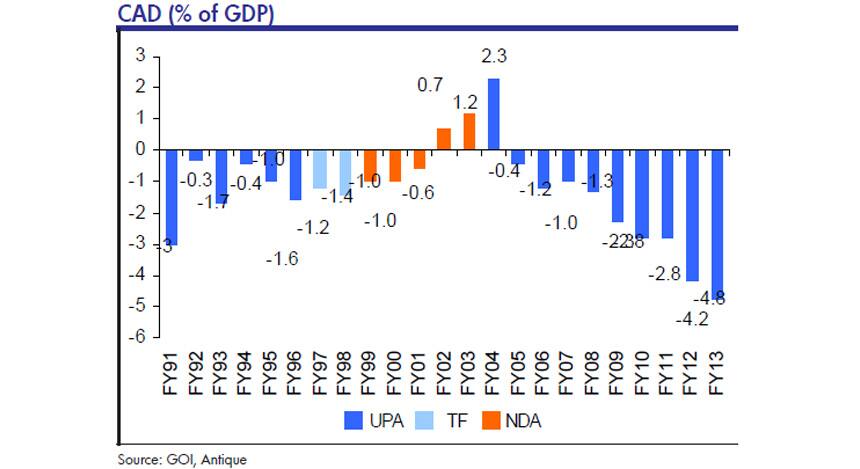
The current account deficit, a measure of how much exports exceed imports, has been the worst under the current UPA regime. However, it also had its best performance under the UPA in FY04. Image: Antique Stock Broking Ltd[/caption]
[caption id=“attachment_80551” align=“alignnone” width=“860”]
 The Indian rupee’s performance over the last decade has see-sawed, but its worst showings have been during UPA governments. The currency’s lowest period was in FY92. Image: Antique Stock Broking Ltd[/caption]
[caption id=“attachment_80552” align=“alignnone” width=“860”]
 The fiscal deficit, the difference between the government’s expenditures and revenues. Image: Antique Stock Broking Ltd[/caption]
[caption id=“attachment_80553” align=“alignnone” width=“860”]
 The GDP represents the value of goods and services produced in a country each financial year. India’s much touted 8% figure was first reached under a Third Front government in FY97, followed by the NDA in FY00 and the UPA in FY04. After a jump to an all-time-best of 9.6% in FY07 under the UPA, the GDP is now expected to be a paltry 4.9% in FY14, below the early 90s’ levels. Image: Antique Stock Broking Ltd[/caption]
[caption id=“attachment_80555” align=“alignnone” width=“860”]
 India’s inflation indexes always grab eyeballs given the recent price hike in daily essential items like vegetables. While the current WPI rates of around 7% seem bad, we’ve had it worse. UPA-led governments saw the inflation index skyrocket to 13.7% and 12.6% of the GDP in the early 90s, the highest in the last 20 years. The lowest rate was seen during the NDA government of FY00 at 3.3%. Image: Antique Stock Broking Ltd[/caption]