
 "GDP back series data: New numbers do not pass the basic smell test; mess of the past has just got worsened")
In January 2015, India moved to a new method of calculating the gross domestic product (GDP). The trouble was that up until day before yesterday, data from only 2011-2012 onwards was available as a part of this new GDP series. Hence, any comparison with the years before 2011-2012 was not possible. [caption id=“attachment_5305381” align=“alignleft” width=“380”]
 Representational image. Reuters[/caption] On Wednesday, nearly four years after moving to a new GDP series, the government released GDP data for the years 2004-2005 to 2010-2011, as a part of the new series. As per this new series, the economic growth between 2004-2005 and 2011-2012, wasn’t as much as was estimated earlier. Take a look at Figure 1, which basically compares the new series with the old series. As is clear from Figure 1, the growth as per the new GDP series has been revised lower for each of the years between 2004-2005 and 2011-2012. In fact, the biggest revision has been for the year 2007-2008, where the growth has been revised from 9.8 percent as per the old series to 7.7 percent as per the new series. The interesting thing is that the nominal GDP growth (which does not take inflation into account) is more or less the same as per the two series. Take a look at Figure 2.
 As can be seen in Figure 2, the two curves, representing the old GDP series and the new GDP series, more or less overlap. In very simple terms, when inflation (or what economists call the GDP deflator) is subtracted from the nominal GDP growth, we arrive at the real GDP growth (plotted in Figure 1). What this basically tells us is that the rate of inflation between 2004-2005 and 2011-2012 was much higher than assumed earlier. This led to the economic growth between 2004-2005 and 2011-2012, being revised downwards. Let’s look at this issue pointwise. 1) The biggest takeaway from this exercise is that the economic growth between 2004-2005 and 2011-2012, and the economic growth between 2011-2012 and 2017-2018, was more or less the same. Between 2004-2005 and 2011-2012, the Indian economy grew at 6.89 percent per year. Between 2011-2012 and 2017-2018, it grew at 6.87 percent per year, which means there was barely any difference. For anyone who has lived through these two periods, this just doesn’t feel right. 2) If the Indian economy grew by 6.89 percent between 2004-2005 and 2011-2012, then all the hype around the so-called India growth story, was basically a big lie. If we weren’t even growing at more than 7 percent per year, where was the growth story? 3) If the Indian economy grew at more or less the same rate between 2004-2005 and 2011-2012, as it did between 2011-2012 and 2017-2018, then this should reflect in other ‘real’ economic indicators as well. The GDP number is ultimately a theoretical construct and that being the case, the way it goes, should also be reflected in the high speed ‘real’ economic indicators like car sales, two-wheeler sales, tractor sales, commercial vehicle sales, non-food credit, corporate tax, personal income tax and a whole host of other economic indicators. 4) Let’s see if the new GDP series is able to pass this basic smell test. Take a look at Table 1. It basically lists the average annual growth (in%) in a given economic indicator, first between 2004-2005 and 2011-2012, and then between 2011-2012 and 2017-2018. Table 1:
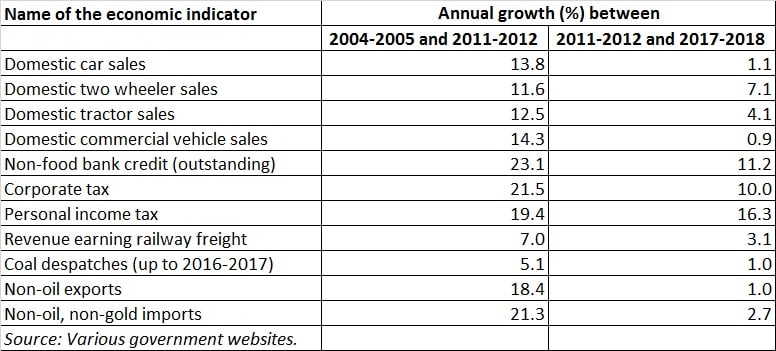 What does Table 1 tell us? It tells us very clearly that the annual growth of the economic indicators, which reflect the performance of different parts of the economy, was much better between 2004-2005 and 2011-2012 than it was between 2011-2012 and 2017-2018. The only indicator where annual growth between 2011-2012 and 2017-2018 comes anywhere near the annual growth between 2004-2005 and 2011-2012, is personal income tax. In some cases, like domestic car sales and non-oil exports, there has barely been any growth between 2011-2012 and 2017-2018. In other cases, like corporate tax, the faster growth tells us that corporate earnings between 2004-2005 and 2011-2012, grew at a much faster pace than between 2011-2012 and 2017-2018. What all this basically tells us is that economic growth between 2004-2005 and 2011-2012 should have been much higher than the economic growth between 2011-2012 and 2017-2018. But as per the new GDP series, this is clearly not the case. Given this, the new GDP series does not pass this basic smell test. 5) One of the points that have constantly been made is that banks went overboard while lending between 2004-2005 and 2011-2012, and that excess lending created economic growth. Also, the excess lending led to a huge amount of bad loans in the year to come, especially for public sector banks. This to some extent has held growth back, post-2011-2012. This is something that makes sense. But with the new GDP series, the economic growth between the two-time frames under consideration is basically the same. Does that mean that bad loans had no impact on economic growth or that all the lending between 2004-2005 and 2011-2012, did not lead to any economic growth? To conclude, as the former Reserve Bank of India governor D Subbarao writes in Who Moved My Interest Rate?: “The poor quality of data is compounded by frequent and significant revisions, especially in data relating to output [GDP] and inflation which are at the heart of monetary policy." As governor YV Reddy puts it with his characteristic wit, everywhere around the world, the future is uncertain; in India, even the past is uncertain. From the looks of it, the past in India, got even more uncertain now, than it was in the past. What does that mean? Go figure! (Vivek Kaul is the author of the Easy Money trilogy).
The biggest takeaway from this GDP back series data is that the economic growth between 2004-2005 and 2011-2012, and the economic growth between 2011-2012 and 2017-2018, was more or less the same.
Advertisement
End of Article

 "US ready to ‘impose costs’ on Russia if war in Ukraine drags on, says Hegseth")
 "US tells Hamas to stop violence against Gaza civilians and disarm 'without delay'")
 "China seizes 60,000 maps mislabelling Taiwan, omitting South China Sea islands")
 "Syria’s Sharaa pledges to honor Russia ties, seeks economic and military support in Kremlin visit")


](https://images.firstpost.com/wp-content/uploads/2018/10/MONEY_RUPEE_Reuters.jpg)
](https://images.firstpost.com/wp-content/uploads/2018/11/Kaul2.jpg)
](https://images.firstpost.com/wp-content/uploads/large_file_plugin/2018/11/1543480984_Kaul3.jpg)