 "Why Indians prefer gold and real estate: Savers have gotten a rotten deal")
If you are wondering why Indians have been buying gold and property till last year, here are two charts that explain this love for physical assets.
The first chart, ( See above) put out by the Urjit Patel Committee on evolving a framework for monetary policy, shows us how Indian savers have been badly cheated by inflation. The red line represents headline consumer price index (CPI) numbers from January 2002 to mid-2013. The blue line is the core (non-food, non-fuel) CPI from the same date.
The green line, which has made a V-shared dive below the X-axis, tells you how badly savers have fared. This line is the Reserve Bank’s policy interest rate (the repo rate) after adjusting for inflation. The policy line roughly cues the direction of deposit and lending rates - and this would show that the central bank has not done much to keep savers’ heads above the inflation waterline.
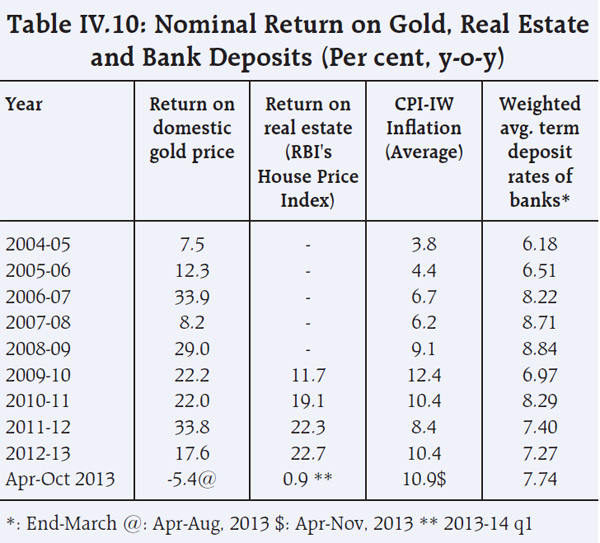
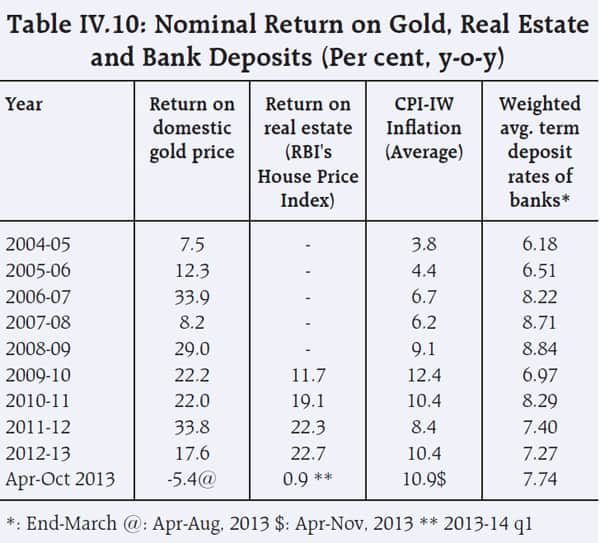
The second chart (a table) explains why, with the government continuing to debauch the value of the rupee, savers have turned to physical assets like gold and real estate for succour.
[caption id=“attachment_75242” align=“aligncenter” width=“600”]
 Source: Urjit Patel report on monetary framework, January 2014[/caption]
This chart shows that in all years since 2004-05 (barring 2007-08) returns on domestic gold and property have exceeded average bank fixed deposit (FD) rates.
Gold beat FDs by several multiples and not just a few percentage points. The last year has not been kind to gold, but this is not because of any change of heart on the part of the RBI or the government about improving saver returns. It is because global gold prices have fallen. But FD rates are still well below CPI inflation - and earning negative real returns for the saver.
The UPA years have been bad for savers.