
 "Sensex is stronger than the Nifty at this juncture")
The Nifty sold off from the resistance levels marked on last week’s article and is now at a gap support level. It is possible for the Nifty to at least pause its sell off and possibly rally a bit. Just like the previous week, the Sensex continues to be stronger than the Nifty, making the 30-share index a better buy than Nifty.
Support areas are levels where the demand for stocks far exceeds supply, which leads to a rally in price. Resistance levels are areas where the supply of stock far exceeds demand, leading to a fall in price. Gaps, on the other hand, are areas of extreme demand and supply imbalance and happen when prices close at one level and open higher or lower the next trading day. A gap-up shows that the supply of stock was non-existent at a certain price level that buyers had to bid up prices much higher to entice sellers into the market.
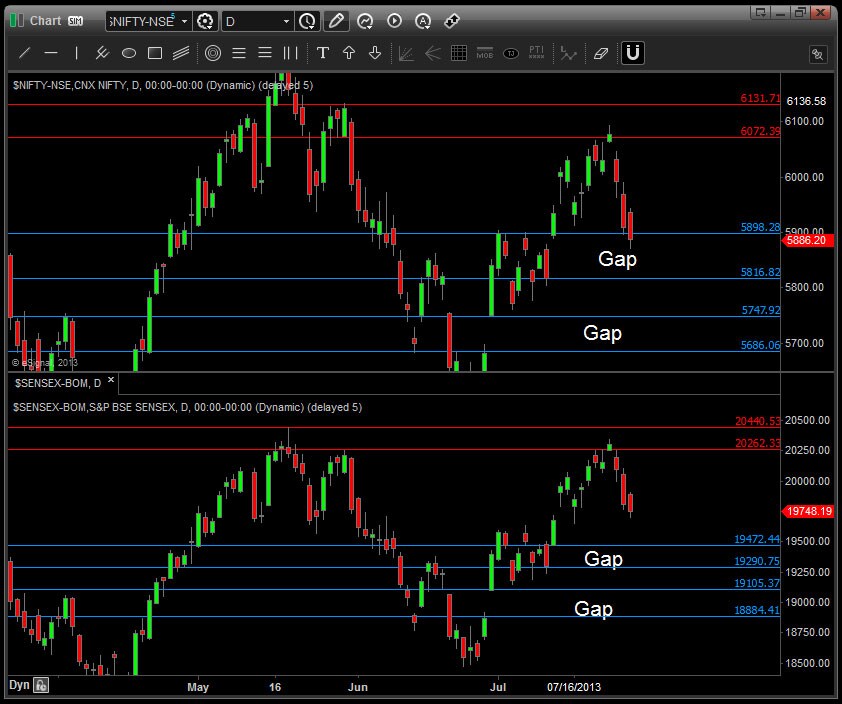
Notice that Nifty has come down to a gap level as shown by the horizontal red lines on the combined Nifty-Sensex chart.
( Click here for chart) The chart on the top is that of the Nifty and the one below is the Sensex. Notice that the Sensex has not yet reached the gap level, indicating relative strength to the Nifty. This essentially means that going long on the Sensex is a better bet than buying the Nifty. On the short side, Nifty is better than the Sensex. However, now is not the time to short the market as prices are at support.
[caption id=“attachment_990773” align=“alignleft” width=“435”] Just like previous week, the Sensex continues to be stronger than the Nifty, making the 30-share index a better buy than Nifty. Reuters[/caption]
The time to short was last week when prices went into resistance zones. We had mentioned in last week’s article that it was time for bulls to book profits and for bears to take on short positions with stops above resistance levels.
The market made quite a few gap support levels on the way back. If both Nifty and Sensex break the higher gap support level, prices can go down to the next gap. Nifty right now is at the gap level created on 11 July. On 10 July, the Nifty closed at 5,816 and opened the next day at 5,894, which is huge 78-point gap. We call it huge because the average true range of the Nifty back then was 84 points. The average true range is the average price a stock moved in the past 14 days, including the gap. The index covered most of that right at the open, given the huge demand. In fact during the day the index ran up 132 points before settling a little lower.
If the higher support level is broken, the prices can go down to the next support level lower, as shown by the red horizontal lines. There is one more gap support level below that but we have not indicated it with horizontal lines. On the Nifty the level is between 5,589 and 5,627.
On the supply side of things, the resistance levels are shown by the red horizontal lines at the top of the chart. Prices have to clear that level to go higher. Notice that the Sensex went above its 30 May 2013 high and the Nifty has not. This clearly shows that the 30-share index is stronger than the 50-share index as of now.
The negative fact for bulls is that gap level of he Nifty is quite wide. This essentially means that stops will be wide, increasing the loss potential in case stops are hit. Stops are placed below the gap support level. A safer way to trade wide gaps is to scale into a full position as prices go deeper into the gap. This reduces the average cost of holding the position. Some traders wait for prices to go into the support and then rally out before taking a position.
 "Russian drones over Poland: Trump’s tepid reaction a wake-up call for Nato?")
 "As Russia pushes east, Ukraine faces mounting pressure to defend its heartland")
 "Why Mossad was not on board with Israel’s strike on Hamas in Qatar")
 "Turkey: Erdogan's police arrest opposition mayor Hasan Mutlu, dozens officials in corruption probe")


