
 "Are scheduled tribes losing out in the job market? NSSO data suggests so")
Are scheduled tribes losing out in the job market? Latest figures put out by the National Sample Survey Organisation (NSSO) indicate that is the case. The unemployment rate among scheduled tribes has increased in urban and rural areas between 2004-05 and 2011-12, according to figures in the NSSO’s report on Employment and Unemployment among Social Groups in 2011-12. Unemployment among urban scheduled tribe men increased from 2.9 percent in 2004-05 to 3.4 per cent in 2011-12, while in the case of urban scheduled tribe women, it increased from 3.4 per cent to 4.8 percent over the same period. In rural areas, unemployment rate for scheduled tribe men increased from 1.1 per cent to 1.3 percent and for scheduled tribe women from 0.4 per cent to 1.1 percent. In the case of all other social groups - scheduled castes, other backward classes and `others’ - unemployment rates have risen only in the case of rural men; they have remained static or declined for rural women and urban men and women. Lack of education does not seem to be an explanation. Unemployment rates for people with secondary level and above education was highest for scheduled tribes (men and women, rural and urban) – 6.8 per cent against 5.8 per cent for scheduled castes, 4.8 per cent for other backward classes and 4.5 per cent for `others’. Besides, the worker-population ratio (WPR, number of persons employed per 1000 persons) for scheduled tribe persons with secondary level and above education was also the highest at 51.8 per cent, against 49 per cent for scheduled castes, 49.3 percent for other backward classes and 48.4 per cent for `others’. But scheduled tribes have the benefit of job reservations in government employment. That perhaps explains the higher WPR. What is pertinent to note is that salaried employment accounts for only 47.7 percent of employment of scheduled tribes in urban areas. The other 52.3 percent are almost equally split between self-employment (26.4 percent) and casual labour (25.9 percent). In rural areas, only 4.8 percent of scheduled tribe people are engaged in salaried employment. The rest are largely self-employed in agriculture (56.4 percent) and casual labour (38.8 percent). Combined data on rural and urban scheduled tribe men and women show that the primary sector (agriculture and allied activities) accounts for 70.4 percent of employment. In the case of other social groups it is 49 percent for scheduled castes, 50.6 percent for other backward classes and 38.1 percent for ‘others’. [caption id=“attachment_323149” align=“alignleft” width=“380”] 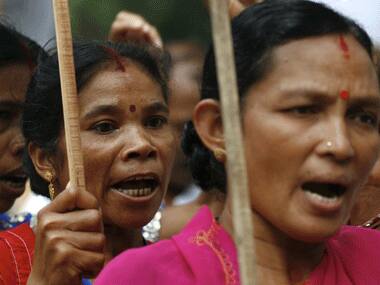 Representational Image. Reuters[/caption] There’s a heartening increase in attendance rates in educational institutions, across social groups. Scheduled tribes and scheduled castes (in that order) may be still lagging behind the other groups, but their catch up rates are faster for primary and secondary education in rural areas. Attendance by scheduled tribe and scheduled caste children in the 5-14 age group increased 21 per cent and 14 per cent respectively between 2004-05 and 2011-12. The increase in the case of other backward caste and `others’ was 10 per cent and 7 per cent respectively. A similar picture emerges in the case of attendance in the 15-19 age group, though the difference is less stark between scheduled tribes, scheduled castes and other backward classes (the increase for all three is in the 54-59 per cent range) against 37 per cent in the case of `others’. In the case of attendance by the 20-24 age group, the increase is massive in the case of the `others’ (123 per cent) and other backward classes (115 per cent), followed by scheduled castes with 93 per cent. The scheduled tribes lag with an increase of just 45 percent. The increase in attendance in the 5-14 age group is not marked in urban areas, perhaps because enrolment was already high. But there’s been a significant increase in attendance by scheduled castes and other backward classes in the 15-19 age group – 42 per cent and 34 per cent respectively between 2004-05 and 2011-12. Urban scheduled tribes lag with only a 21 per cent increase in this category. The increase in their attendance in the 20-24 age group is a piffling 6 percent against 55 percent and 66 per cent in the case of scheduled tribes and other backward classes respectively. Even the `others’ record a 42 per cent increase in attendance. The dropping off between different levels of education has also come down significantly across social groups. In 2004-05, the percentage of attendance in the 15-19 age group was between 42 per cent and 55 percent less than attendance in the 5-14 age group across rural areas, and between 24 percent and 44 percent in urban areas. This drop declined in 2011-12 to between 26 percent and 41 percent in rural areas and between 19 percent and 28 percent in urban areas. The quality and relevance of this education, however, needs to be looked into. Unemployment rates for scheduled caste and other backward class persons who have completed a diploma/certificate education are high at 12 per cent and 10 per cent respectively. For the scheduled tribes, the unemployment rate for this category is 5.5 percent and for `others’ it is 4.7 percent. The rate drops for scheduled tribe and other backward class graduates (10.5 percent and 8.2 percent respectively) but goes up for scheduled tribes (8.9 percent) and `others’ (6.4 percent). Unemployment rates do go up with higher education levels. Those who are not literate or have just completed primary school are rarely unemployed; they cannot afford to be. Those with higher levels of education often tend to find it difficult to get jobs that match their qualifications. This may not be because they are being needlessly choosy; it could well be that their education and training is not in line with what the market needs. The problem of unemployment requires a deeper study of this mismatch and serious efforts to bridge the gap.
Unemployment rates for people with secondary level and above education was highest for scheduled tribes (men and women, rural and urban) – 6.8 per cent against 5.8 per cent for scheduled castes, 4.8 per cent for other backward classes and 4.5 per cent for `others’.
Advertisement
End of Article
 "Israel targets top Hamas leaders in Doha; Qatar, Iran condemn strike as violation of sovereignty")
 "Nepal: Oli to continue until new PM is sworn in, nation on edge as all branches of govt torched")
 "Who is CP Radhakrishnan, India's next vice-president?")
 "Israel informed US ahead of strikes on Hamas leaders in Doha, says White House")


](https://images.firstpost.com/wp-content/uploads/2012/05/indian-tribes.gif)