 "Nifty breakdown confirms bear market; coming next - 4,800")
The Sensex and Nifty finally broke below their key support levels to confirm a medium-term bear market in the week ended 11 May. The next down targets seem to be the 16,000 and 4,800 levels respectively. There are, however, a few hurdles that the bears have to clear before hitting their targets and these hurdles can stop and reverse the downtrend.
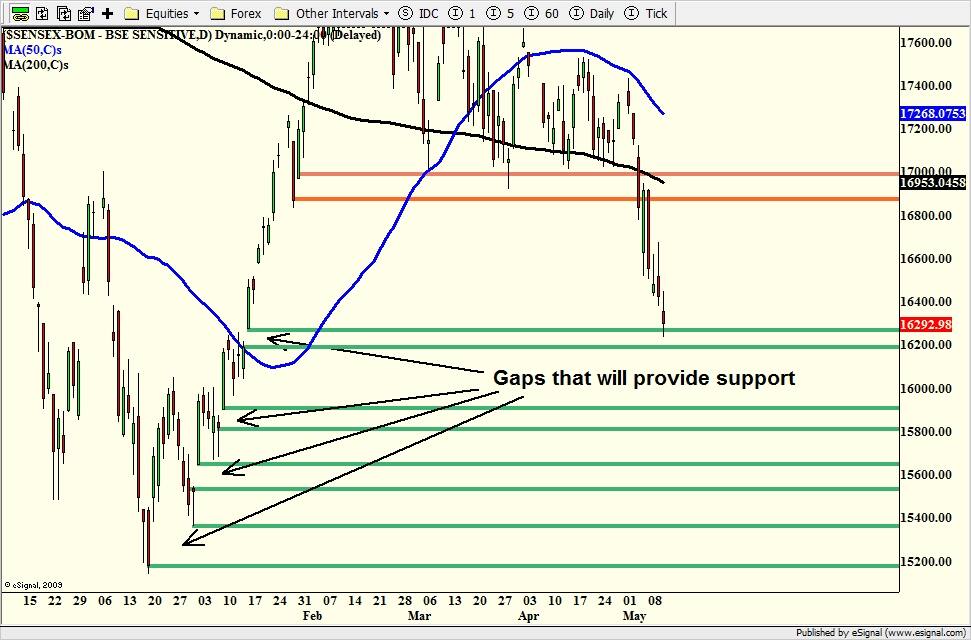
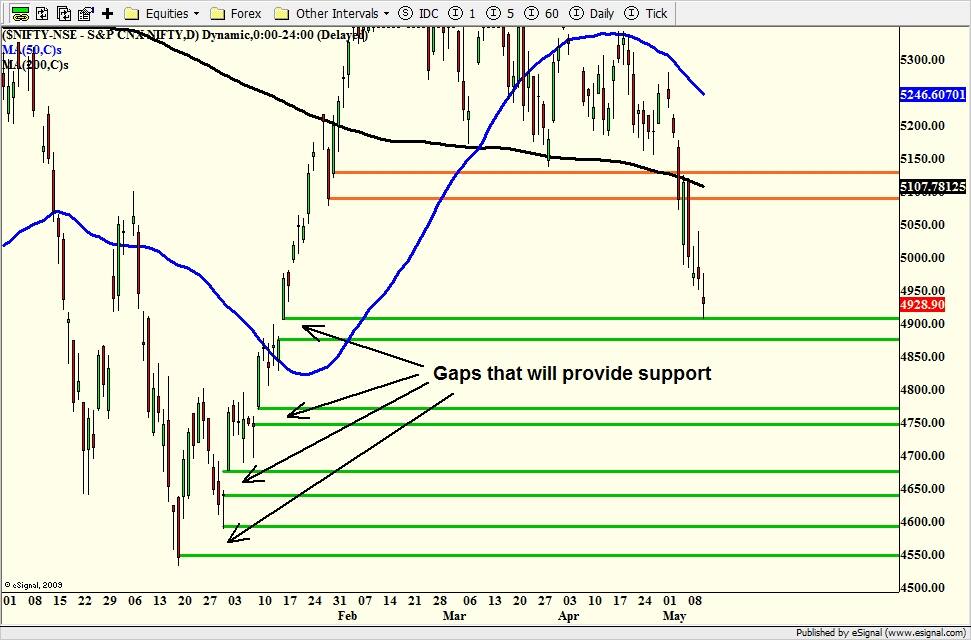
The bear market was confirmed on Friday when both the indexes closed below their 200-day simple moving averages (SMA). The 200-day SMA for the Sensex was at 16,953 and the index closed on Friday at 16,292. The Nifty closed at 4,928 with the SMA at 5,107.
[caption id=“attachment_307065” align=“alignleft” width=“380” caption=“The Sensex and Nifty finally broke below their key support levels to confirm a medium-term bear market in the week ended 11 May.”]
 [/caption]
Given that the key support provided by the gaps on both the indexes have been broken it is likely that the Nifty will hit 4,800 and Sensex 16,000 in the near future. (Click here for charts of Sensex and Nifty ) We will talk about gaps and their importance later in the article. In fact, a powerful bear can take the Nifty even lower to 4,600 and the Sensex to 15,400.
In the previous week’s article we had mentioned that if the Sensex and Nifty closed below the gap support, it would go lower. The gap support is marked by the red horizontal lines on the charts. We had also mentioned that traders should wait for a corrective rally back-up to the gap support level before shorting. In fact, prices rallied up to the level on Monday before falling lower.
Now we have a confluence of bearish factors weighting down the market and they are:
• The breakdown from the gap support
• The gap support acting as resistance to stop and reverse Monday’s corrective rally. We will talk more of this below
• The indexes are below the 50-day, and 200-day moving averages as shown respectively by the blue and black lines on the charts
• Both the averages are pointing down
• The 200-day is now preventing prices from moving up. Last Monday, the rally hit the 200-day SMA from below and could not break above and failed the next day to go lower.
However, bears face a few hurdles before the index go substantially lower. They have to clear a few gaps which are strong support areas. Prices often rally from support levels or stop falling for some time as they are areas where demand for stocks exceeds supply. The support levels are marked by green horizontal lines on the charts. They can be used as profit targets for short positions and as the level to go long on for a short-term trade.
Lesson on gaps
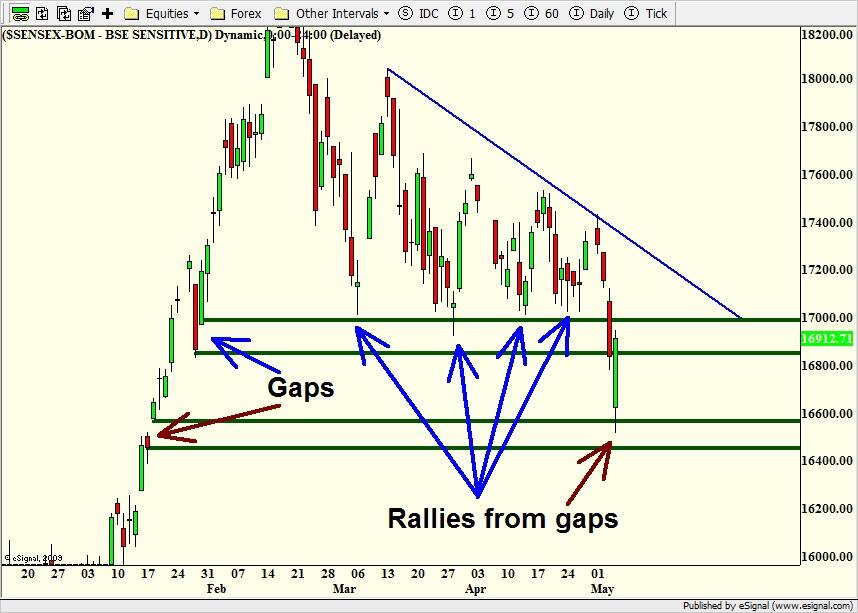
So why are gaps so important? The Sensex on Monday provided an excellent example of the power of gaps to stop and reverse price direction.
We will use this example to learn more about gaps. ( Click here for chart ) A price gap happens when the opening price of a day is higher or lower than the closing price of the previous day. When there is extreme demand, prices open much higher than they closed the previous day. Prices open lower than the previous close in areas of extreme supply.
On 19 and 31 January this year, the Sensex opened higher than it closed the previous trading day. On 19 January, the Sensex opened at 16,573 after closing at 16,451 the previous trading day and on 31 January it opened at 16,965 after closing at 16,863 on the previous trading day.
On the chart you’ll see two sets of horizontal lines showing the gaps. The lower set shows the price gap on 19 January and the upper set shows the gap of 31 January. The upper line in each set begins at the level where prices opened higher and the lower one shows where the prices closed the previous day.
The proof that gaps are areas of extremely strong demand from where prices turn higher is shown on the chart. The area of gap on 31 January is also pointed out by a blue arrow. The other blue arrows on the chart show that the Sensex hit that level four times and rallied before going below the gap.
Finally, on Monday (7 May), the Sensex went below the 31 January gap, but unfortunately for bears it went into the gap created on 19 January and rallied strongly back up. The gap and rally are shown by red arrows.This again shows the power that gaps have to stop and reverse price direction.
Conclusion
Now, as the markets go lower, the gaps can stop the fall and lead to a rally. In fact, the chart shows that both the indexes closed near gaps last Friday. Hence its possible that the fall might have stopped for a while. Now that we know the power of gaps let’s treat them with respect.
George Albert is Editor, www.capturetrends.com
George Albert is a Chicago-based trend watcher and edits www.capturetrends.com