
 "Dollar fails to sustain breakout, increasing risk appetite")
The US Dollar failed to sustain its breakout and rally as the chatter of further bond buying by the European Central Bank and Federal Reserve enticed investors to riskier assets such as equities at the expense of safe havens such as the greenback, US treasuries and Japanese Yen. Before rejoicing equity bulls must take note of the warning signs - falling treasury prices despite talk of easing and a potential bullish breakout in gold.
Political leaders in Europe are vowing to do “anything” to save the Euro, which resulted in a rally in equities. Interestingly, anything to save the Euro seems a tacit approval by the political class that the Euro is in trouble. The markets have not seen such a desperate political talk up of the Euro in the past. The only sane voice in this yet another attempt to save the Euro is that of the German Bundesbank, which is stated that it’s not in favour of another bond buying program. But the markets believe that the bond buying program will go ahead despite objections from the Bundesbank.
[caption id=“attachment_394567” align=“alignleft” width=“380”]  Unless the index closes below the support level 81.12 a sell off in the dollar is not possible and a sustained rally in equities difficult. AFP[/caption]
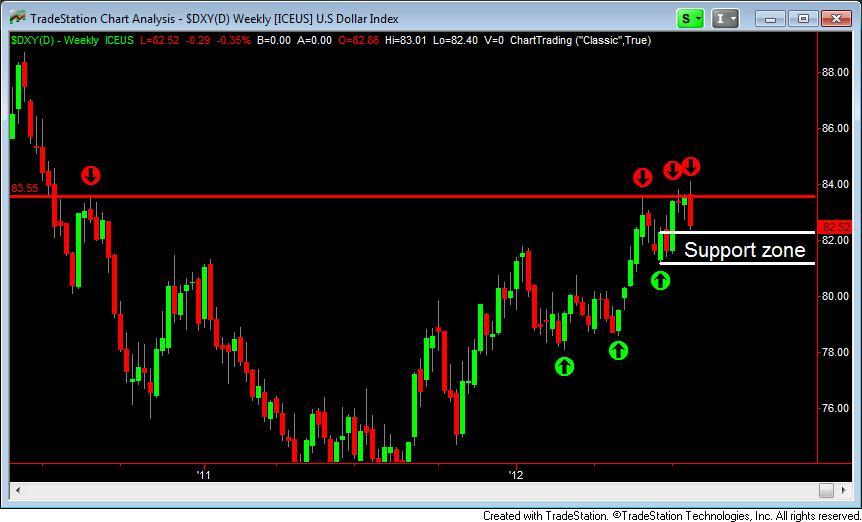
A look at the chart of the Dollar index ( **Click here for chart** ) shows that the greenback has not been able to close above the 83.56 level on a weekly chart despite three attempts. The 83.56 level as shown by the red horizontal line on the chart is a resistance level. Resistance levels are zones where the supply of an asset exceeds demand leading to a fall in price. With each attempt the index made a higher high indicating the possibility of a sustained breakout only to fail and sell off on comments of further easing. A higher high is when the newest high in price is higher than the previous high.
A look at the dollar chart will show that the index is now near its support level around 82 as shown by the green horizontal lines on the chart. A support level is where the demand for an asset exceeds supply, leading to a rally in price. Unless the index closes below the support level 81.12 a sell off in the dollar is not possible and a sustained rally in equities difficult.
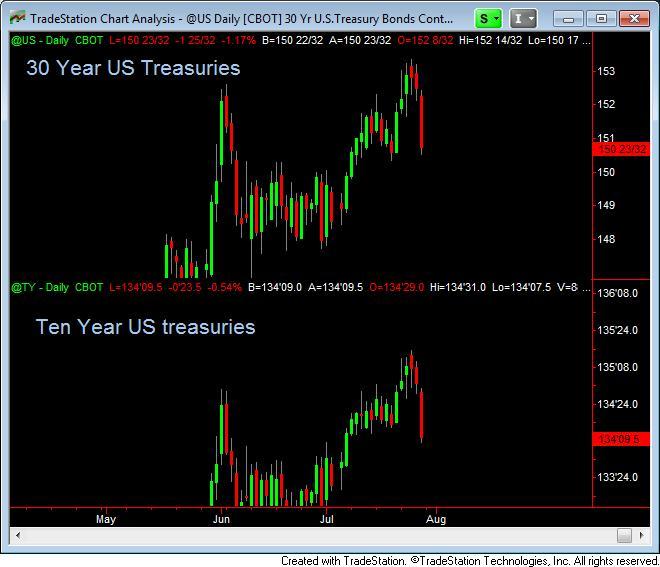
The fall in US treasury prices is giving a mixed signal. ( **Click here for treasury chart** ) If in fact the market believes that the Fed will ease money supply further the treasury prices should not have fallen. However, for now it’s more likely the fall in treasury prices could be the result of investors selling bonds to buy equities. A sustained fall in the treasury prices would not be good for equities as it drives up interest rates. Bond prices moves inversely to interest rate. If interest rates rise, it will slow an already decelerating US economy, which will push equity prices down, but that’s a long way off. For now falling treasury prices is a positive for equities.
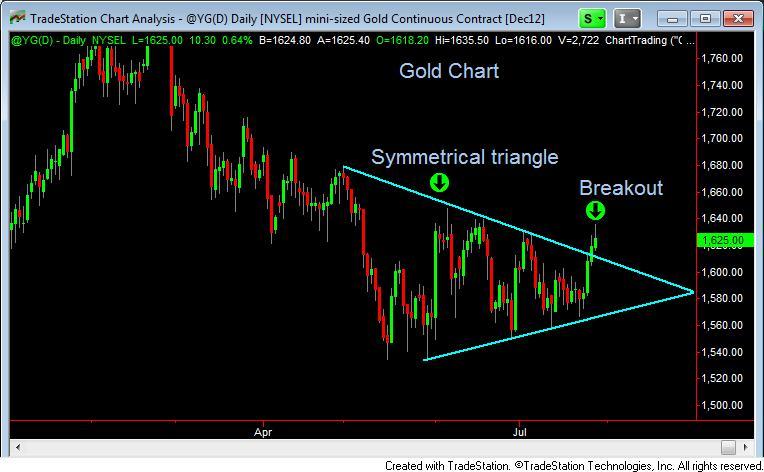
However, a key asset to take note of is gold. Gold which was setting up for a bearish breakdown given the potential rally in dollar had a bullish break out this week. A look at the gold chart ( **Click here for the gold chart** ) will show that precious metal was moving in a symmetrical triangle chart pattern. In a symmetrical triangle pattern prices move in a continuously narrowing range. Once it breaks out of the range price heads in the direction of the break.
When the central banks ease money supply the price of gold tends to rally. Gold often competes with fiat currencies for primacy as sound money. Hence when the supply of fiat money increases just like the market expects from the Fed and ECB the price of gold goes up. Rising prices in gold also indicate the possibility of inflation which seems possible given the drought ravaging several parts of the globe. A shortage of food supply and excess of liquidity in the system is sure to trigger strong inflation.
So in the final analysis one has to wait and see if the strong rally in equities is sustainable. Keep an eye on the 81.12 level of the Dollar index. If the index falls below that we could see a rally in equities.
 "Israel targets top Hamas leaders in Doha; Qatar, Iran condemn strike as violation of sovereignty")
 "Nepal: Oli to continue until new PM is sworn in, nation on edge as all branches of govt torched")
 "Who is CP Radhakrishnan, India's next vice-president?")
 "Israel informed US ahead of strikes on Hamas leaders in Doha, says White House")


](https://images.firstpost.com/wp-content/uploads/2012/07/dollar-afp.jpg)