 "Does Economic Survey know what it is talking about?")
By MH Suryanarayana
An annual economic survey, ipso facto, has to be an economic status report, backed up with factual information on contemporary economic problems, their policy reviews and imperatives. Thus it provides a crucial base for annual policy formulation as well as evaluation. However, given our disregard for precision, methodology and procedures, India appears no different from Somalia on such matters.
Somalia is an ’economy without a state’ or with an institutional capacity for information generation and use. While Somalia cannot identify problems and formulate policies for good reasons, India has the information base but does not bother much about concepts, estimates, their uses and implications. The latest Economic Survey 2012-13, and a chapter on ‘Human Development’ in particular, is no exception.
Being an annual pre-budget survey, its focus and orientation has to be short-run with a medium-term horizon. The comedy of the Survey begins with a seemingly good academic review chapter on ‘Seizing the Demographic Dividend’. It seeks to set up a ‘short run bridge to the long run’ by addressing ’the central long run question: where will good jobs come from?’ Strictly from a policy formulation perspective as well as the mandate of the ministry of finance, this chapter would befit a five-year plan strategy document than an annual economic survey.
A sound economic review would presuppose a valid information base, clarity of concepts, good understanding of measures and estimates, and most importantly, clear communication. As regards conceptual clarity, the survey has a long way to go. It has a very general description of ‘Inclusive Development’ in terms of its major dimensions ’like poverty alleviation, employment generation, health, education, women’s empowerment, and social welfare’. What do these terms mean? What are the goals, indicators and targets? How does one measure and evaluate? It is left to the reader’s imagination. The same holds good when it comes to the review of food security elsewhere in the document.
Reporting on the country’s achievement in human development (HDI), the survey blindly cites UNDP estimates of ‘average annual HDI growth’ reported in its Human Development Report 2011. It commends India’s achievement in human development as “a growth rate in average annual HDI of India between 2000-11 is among the highest”. For the survey, “average annual HDI growth” and “a growth rate in average annual HDI” are synonyms. But they are not. There is nothing called average annual HDI. Most importantly, one is not sure what conceptual sense one could make of such estimates of growth rates in average normalised scores of variables with different units of measurements and goalposts. To cap it all, the survey provides neither the motivation for nor any outcome evaluation based on such statistics for human development.
One comes across such a confused description once again in Table 13.5, which presents estimates of ‘Annual Average Decline’ in poverty during different sub-periods. There is a difference between ‘Average Annual Decline’ and ‘Annual Average Decline’; what the Table has presented are estimates of the former. So much for clarity of understanding and communication.
The survey provides a good deal of information on poverty, its estimates and their description. It authenticates neither the very concept and estimator of poverty nor the information base for their estimates. One does not really know how sound and valid are the concept and estimator recommended by the Tendulkar Committee. Nor is there any understanding of what the NSS (national Sample Survey) estimates of consumption distribution measure. The survey completes its review of poverty without any evaluation of outcomes and discussion of policy imperatives.
The survey reports estimates of measures of inequality in income distribution across countries from the same UNDP report. It highlights its finding that “inequality in India is lower than (that in?) many other developing countries.” It does not quote but plagiarises the UNDP definition of income Gini coefficient verbatim as “the deviation of the distribution of income (or consumption) among individuals or households within a country from a perfectly equal distribution”, which is wrong.
The Gini coefficient is a measure of relative inequality defined as ‘one-half of relative mean difference’; its estimator is algebraically equal to that of the Lorenz ratio measure of inequality, which measures the deviation of income/consumption shares and not income/consumption from the line of equal distribution.
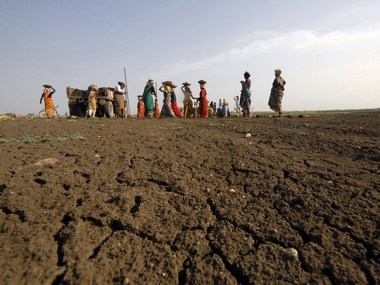
[caption id=“attachment_650468” align=“alignleft” width=“380”] The National Sample Survey (July 2009-June 2010) has shown that only about half (45 percent) of the rural households depend upon the MGNREGA. Reuters[/caption]
Further, the estimates reported for different countries are not comparable since some pertain to consumption distribution while others to income. Most important to note is the fact that India does not have estimates of income distribution at all.
There is also some coverage of policy responses to different dimensions of deprivation. One such description pertains to the MGNREGA, the jobs guarantee scheme for rural areas. It contains only a select statistical profile of the programme and its outcomes, and not any problem, its correlates and challenges. In fact, the survey does not mention the sagging demand for MGNREGA employment; total persondays of employment created was 284 crore in FY 2009-10, which declined to 257 crore and 209 crore respectively during the subsequent two financial years.
The National Sample Survey (July 2009-June 2010) has shown that only about half (45 percent) of the rural households depend upon the MGNREGA. Even among the scheme’s job seekers, about 45 percent do not get employment. While more than half of them did not get employment in Karnataka and Kerala, the same ratio was less than half for Chhattisgarh, Madhya Pradesh, Rajasthan and West Bengal; it was the least for Rajasthan (16 percent). These are the challenges which call for reviews and policy attention.
In sum, the survey is sloppy and silent on precisely the topics it is expected to cover, analyse and explore - that is, economic problems, their profiles, and policy imperatives. Thus, the Economic Survey 2012-13 toohas missed out on the fundamentals.
The author is with the Indira Gandhi Institute of Development Research, Mumbai. An earlier version was posted here.