
 "Copper's weakness, dollar's strength threaten equities")
By George Albert
Copper, a lead indicator of risk appetite in the financial markets, faces headwinds as prices are nearing a key area of resistance. The US dollar, on the other hand, sold off last week, and was into an area of support at the close of trading on Friday.
Copper often acts as a lead indicator to the direction of riskier assets such as equities. A rally or selloff in copper is often followed by the equity markets. In fact, the copper index made a low on 20 June and then made higher lows before rallying strongly. The US equity markets made a low on 23 June and then began to rally. The BSE Sensex too began to rally on 23 June.
[caption id=“attachment_46808” align=“alignleft” width=“380” caption=“The metal is used in several manufacturing processes and an increase in the demand for copper indicates that the economy may be gathering steam. Reuters”]  [/caption]
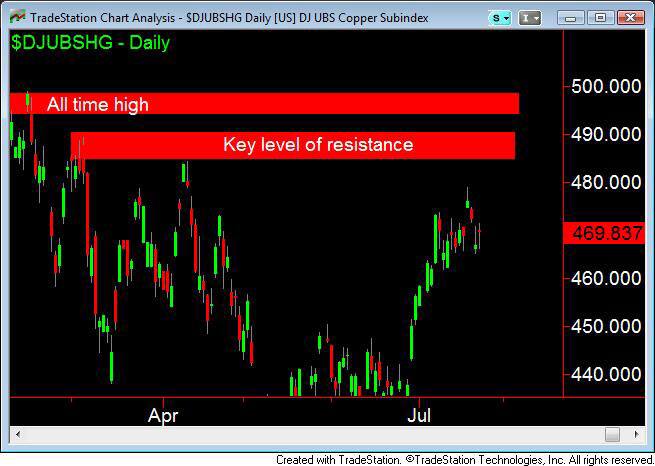
Now the rally in the equity markets can fade in the near future as copper faces strong resistance. On the UBS copper index, the level of resistance is between 485 and 490. The index closed at 469 last Friday.
Even if copper is successful and moves higher than the resistance level, it faces resistance at the metal’s all-time high of 500. The number 500 is also a psychologically strong round number to cross. A chart nearby shows the resistance levels in red. View Chart
There is a reason why copper is a leading pointer to where equities may head. The metal is used in several manufacturing processes and an increase in the demand for copper indicates that the economy may be gathering steam. There is lag between the purchase of copper by a manufacturer and completion of the product, its sale and revenue realisation. Increased revenue realisation by companies results in a rise in equity prices. Hence we see copper prices leading the equity markets.
While the fundamental connection between copper and equity markets cannot be measured over a very short period like a week or two, the fact that copper historically leads the equity markets results in short-term traders reacting to moves in the metal.
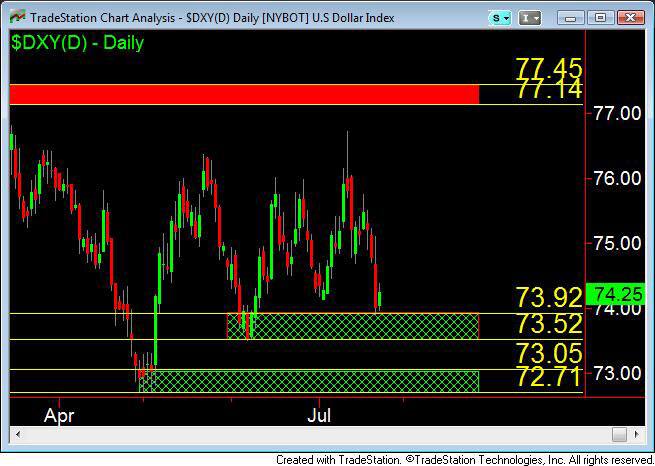
The US dollar: If copper and equities are the risk plays, the US dollar is a safe haven from risk. Hence, one will often see a selloff in risk assets when the US dollar rallies. A look at the dollar index chart shows that it is near a support level. The areas marked by the green boxes are support levels. The box in red is the resistance level.
Prices often rise from support and fall from resistance. The first level of support for the dollar index is between 73.50 and 74. The next level below it is between 72.25 and 73. View Chart
Just like bulls face headwinds in copper, bears face headwinds in the dollar. The alignment of resistance in copper and support in gold - another safe haven asset - increases the odds of a reversal in both asset classes as well as equities.
The dollar itself has been very volatile, often confusing both the bulls and bears. The charts indicate that the dollar is bullish despite last week’s selloff. The reason for the bullishness is that the greenback has been making new highs since its last low at the end of April. It has not made a new low.
A market making higher highs but and lower lows is essentially bullish. This shows that sellers have not been able to push prices lower, but that buyers have been successful in taking prices higher.
George Albert is a Chicago-based trend watcher and edits www.capturetrends.com
 "Israel targets top Hamas leaders in Doha; Qatar, Iran condemn strike as violation of sovereignty")
 "Nepal: Oli to continue until new PM is sworn in, nation on edge as all branches of govt torched")
 "Who is CP Radhakrishnan, India's next vice-president?")
 "Israel informed US ahead of strikes on Hamas leaders in Doha, says White House")


](https://images.firstpost.com/wp-content/uploads/2011/07/copper1.jpg)