
 "Budget 2015: Three graphics that explain FM Jaitley's task on deficits")
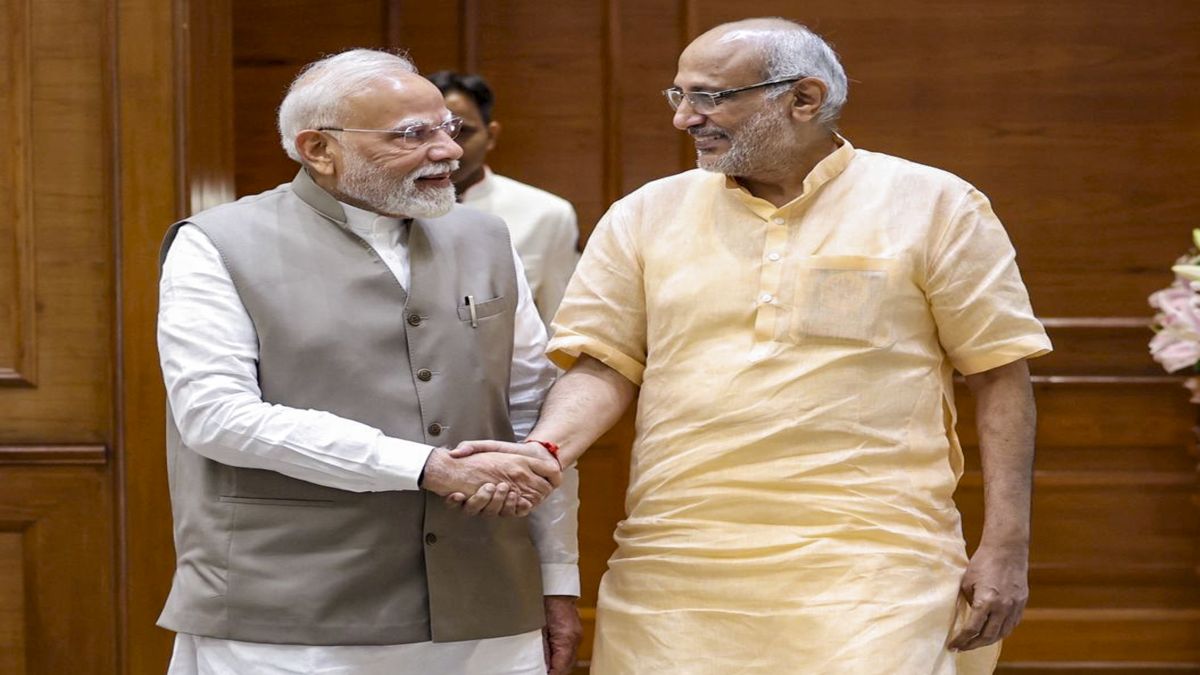
One of the most closely watched numbers in the Budget, the fiscal deficit, is the difference between a government’s revenues and its expenditure. This gap has to be bridged by borrowings. The budget gives out the revised estimate of the deficit for the previous financial year and also the estimate for the next. [caption id=“attachment_2109599” align=“alignleft” width=“380”]  Union Finance Minister Arun Jaitley. PTI[/caption] The number, expressed both in absolute terms and as a percent of GDP, is important as it gives an indication as to how the government is managing its expenses. The smaller the number, the better. So, the government’s endeavour should ideally be to bring the deficit under manageable levels. A higher fiscal deficit means the government will borrow more from the market through issuance of government securities. This would, in turn, result in higher interest burden on the government. Thus a higher fiscal deficit reveals the financial weakness of the government. Apart from fiscal weakness, what also bothers the markets in a high-deficit scenario is the increased supply of government securities, which pulls down the value of such instruments. This would spiral the borrowing cost in the economy. Heavy government borrowings can also crowd out corporates from the fund raising market. Over the last few years, India’s fiscal deficit has widened due to various factors, including the 2008 global financial crisis and the government’s spending spree. In the wake of the crisis, which forced the government to spruce up spending and roll out a stimulus to revive the economy, the UPA had to shelve the Fiscal Responsibility and Budget Management Act. The Act was aimed at progressively reducing the fiscal deficit to 3 percent of GDP by 2008 and eliminating revenue deficit. In 2012-13, then finance minister P Chidambaram again drew up a roadmap to contain the deficit. As per this plan, the deficit has to be contained at 4.2 percent this year, 3.6 percent in 2015-16 and 3 percent in 2016-17. Following are a few graphics that gives you the trend of India’s fiscal deficit from 2005-06. Graphic 1: Fiscal deficit in absolute terms (Rs lakh crore): 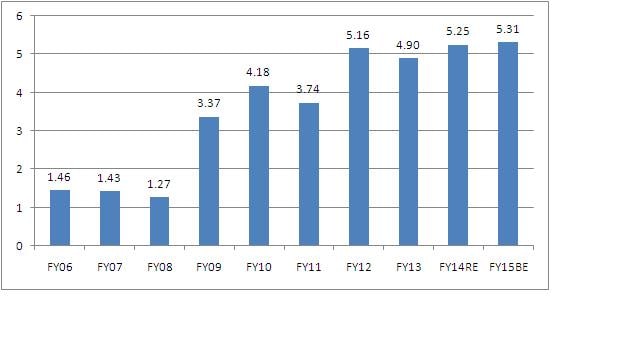 In absolute terms, India’s fiscal deficit has been almost steadily increasing over the last 10 years. From just Rs 1.46 lakh crore in 2005-06, the number has risen about 264 percent to Rs 5.31 lakh crore during the period. The deficit witnessed a fall only thrice during the 10-year period - from Rs 1.43 lakh crore in 2006-07 to Rs 1.27 lakh crore in 2007-08; from Rs 4.18 lakh crore in 2009-10 to Rs 3.74 lakh crore in 2010-11; and from Rs 5.16 lakh crore in 2011-12 to Rs 4.90 lakh crore in 2012-13. The steepest 165 percent increase in the deficit happened between 2007-08 and 2008-09 - from Rs 1.27 lakh crore to Rs 3.37 lakh crore. This was due to global financial crisis that prompted the government to increase its expenditure to revive economy. Graphic 2: Deficits as a percent of GDP: 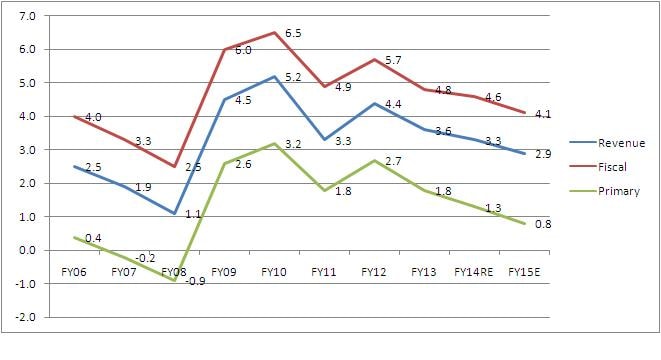 As a percentage of GDP, India had the highest fiscal, revenue and primary deficits during 2009-10 - 6.5 percent, 5.2 percent and 3.2 percent. Revenue deficit is when the government’s revenue expenses (excluding capital expenses) overtake actual revenues. The primary deficit is the number you arrive at after you deduct interest payments from the fiscal deficit. A higher revenue deficit means the government has not been able to meet its expenditure from the revenue it earns. Graphic 3: Govt borrowing in absolute terms and interest payments 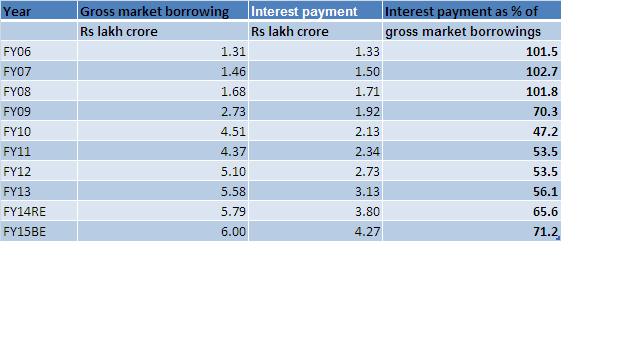 Along with the steady increase in fiscal deficit during the period, the government’s borrowing has also seen a significant increase. An increase in borrowing naturally means higher interest payments. As the graphic above shows, interest payment as a percent of gross market borrowing which had been more than 100 percent during 2005-06, 2006-07 and 2007-08, came down significantly to just 47 percent in 2009-10. But with the spike in market borrowing in 2009-10, the component surged again. In 2014-15, it hit 71 percent. What this means is that nearly three-fourths of the money the government borrowed was being paid back as interest. Will the fiscal deficit this year be reined in at the targeted 4.1 percent of GDP? The Narendra Modi government has the benefit of lower crude prices which have declined to below $50 per barrel. With decontrol of petrol and diesel, fuel subsidy has been contained somewhat. But then the government has to step up investment to revive the economy. This is why the fiscal deficit for 2015-16 will be watched closely. (Data compiled by Kishor Kadam)
A higher fiscal deficit means the government will borrow more from the market through issuance of government securities.
Advertisement
End of Article

 "Israel targets top Hamas leaders in Doha; Qatar, Iran condemn strike as violation of sovereignty")
 "Nepal: Oli to continue until new PM is sworn in, nation on edge as all branches of govt torched")
 "Who is CP Radhakrishnan, India's next vice-president?")
 "Israel informed US ahead of strikes on Hamas leaders in Doha, says White House")


](https://images.firstpost.com/wp-content/uploads/2015/02/ArunJaitleyHalwa380PTI.jpg)
](https://images.firstpost.com/wp-content/uploads/2015/02/deficit-graphic1.jpg)
](https://images.firstpost.com/wp-content/uploads/2015/02/deficit-graphic2.jpg)
](https://images.firstpost.com/wp-content/uploads/2015/02/deficit-graphic3.jpg)