By George Albert
Equity markets in the US and India have been whipping both the bulls and bears around, confusing players about the direction the market wants to take. The markets may have confounded many, but chart watchers know that prices are behaving “rationally”.
US and European players have been watching their governments throw a lot of remedies at the economy, but the resulting rallies never sustain. On the negative side, one sees a lot of news about the economic slowdown and hears that the Greek debt crisis will explode despite steps by the European Union.
[caption id=“attachment_97143” align=“alignleft” width=“380” caption=“The markets may have confounded many, but chart watchers know that prices are behaving “rationally”.Reuters”]
 [/caption]
The market, however, refuses to fall as rapidly as the bears expect it to. In India, too, the bears have been frustrated as the selloff has paused, despite rising inflation and continuously increasing interest rates.
The reason for the pause is simple and here’s the explanation. Markets move from one area of price equilibrium to another. In an area of equilibrium, demand and supply are in balance. Once demand and supply are out of balance, prices begin to rally or fall.
For instance, if supply exceeds demand, prices will fall in search of buyers. Prices will only stop falling once they reach a new area of equilibrium, where buyers equal the number of sellers.
Generally, in an area of equilibrium, prices tend to be range-bound. Market players call this an area of congestion or consolidation. The reason is simple. When buyers and sellers are in balance there is no need for prices to rally or sell off drastically to find buyers or sellers.
Sometimes these ranges are wide - as it is now - and sometimes they are narrow. But given the fact that there are enough buyers and sellers to satisfy each other, prices stay within a range. Once either buyers or sellers are exhausted, prices take a new direction again.
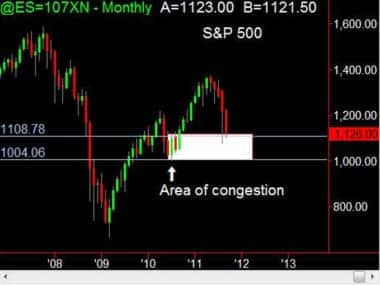
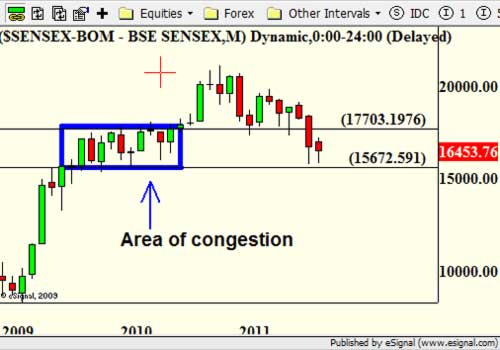
Now let’s look at two market truisms. First, the charts are footprints of what buyers and sellers did in the past. Second, price has memory. When buyers and sellers are in balance, the charts will move sideways, as shown by the blue box in the Sensex chart and by the white box on the S&P 500 chart.
[caption id=“attachment_97145” align=“alignleft” width=“380” caption=“S&P500”]
 [/caption]
When buyers exceed sellers, one will see the charts move up. So looking at the chart one can say if prices moved sideways during a certain period of time or if they moved up.
Now since price has memory, whenever the market comes back to an area of congestion, it tends to move sideways or rapidly bounce. Now the Sensex and the S&P 500 are moving sideways, as we are in a bear market, which makes sustainable bounces difficult.
From June 2010 to August 2010, the US index moved in a 100-point range of 1,000 to 1,100. That’s where the index has been falling, too, and bouncing for the past two months. The market stayed in that range for three months and will hence take some time to break below it.
Till all the buyers at the consolidation level are exhausted the S&P 500 will not go down. We will know that the buyers are exhausted, once the index closes below the 1,000 level.
It’s also possible for the index to bounce from this level as it had done at the end of August 2010. However, most chart indicators have turned bearish, which increases the downside risk.
The Sensex has had a much longer period of consolidation of nearly 13 months from the middle of 2009 to the middle of 2010. However, the index has cleared most of the congestion area as prices are now near the bottom of the consolidation area, as shown by the blue box. A look at the S&P 500 shows a slightly different picture, with the index at the top of the consolidation level.
Since the market does not take clear direction during a consolidation period it makes it difficult for long term players. However, traders can sell or short at the top of the consolidation range and buy at the bottom.
[caption id=“attachment_97144” align=“alignleft” width=“500” caption=“Sensex congestion”]
 [/caption]
George Albert is Editor www.capturetrends.com
George Albert is a Chicago-based trend watcher and edits www.capturetrends.com
)