 "The short-term is bleak for stocks; only gold is bullish")
The wild gyrations of the US equity markets pushed the Sensex and Nifty outside their consolidation patterns, increasing the possibility of a further sell off in the Indian markets. All the asset classes moved wildly last week, except for gold, which stayed relatively steady.
View Sensex Chart View Nifty Chart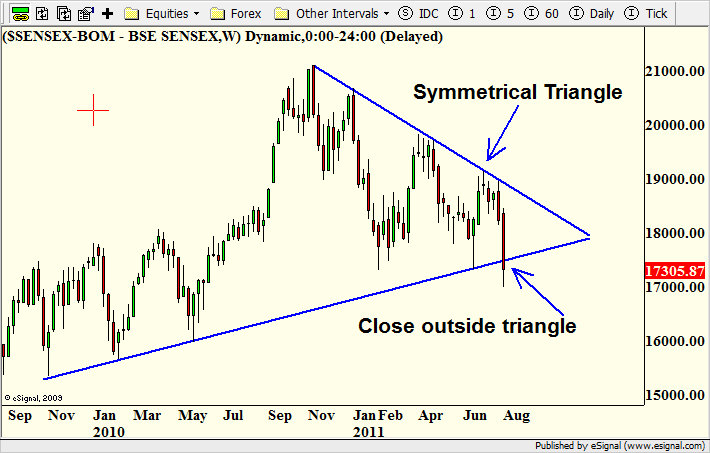
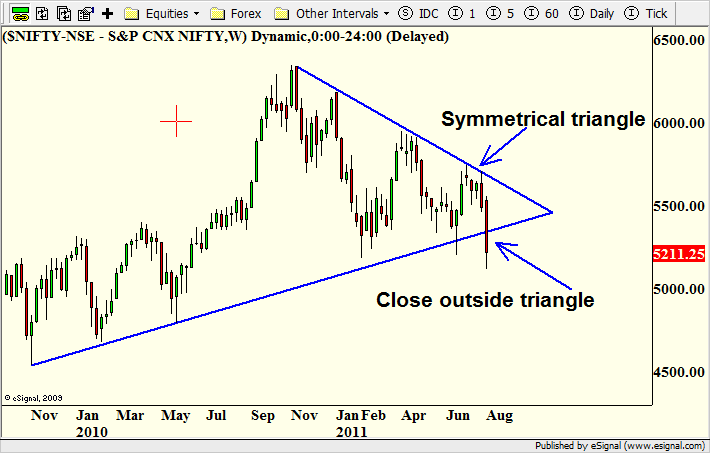
In our article dated 2 July, we had mentioned that the Sensex was moving in a consolidation pattern called a symmetrical triangle. Textbooks state that a break outside the triangle will result in the asset class moving strongly in the direction of the break. Since the Sensex and Nifty broke to the downside, there is a high probability that they will continue to fall further.
In a symmetrical triangle, price moves in a continuously narrowing range as buyers and sellers battle to give the market direction. The narrowing range forms a symmetrical triangle when the peaks and valleys in price are connected.
Once prices break out of the triangle they usually have explosive moves in the direction of the break. Hence a break to the downside can push prices lower and vice-versa. Professional traders tend to avoid asset classes moving inside a symmetrical triangle and take positions only after prices close outside the triangle.
[caption id=“attachment_55845” align=“alignleft” width=“380” caption=“Fundamentally speaking, the effects of the debt crisis in Europe and the sharp growth deceleration in the US are expected to chill markets around the world. Reuters”]
 [/caption]
Fundamentally speaking, the effects of the debt crisis in Europe and the sharp growth deceleration in the US are expected to chill markets around the world. India and China have been applying the brakes on growth for some time.
Now with the spreading of the euro debt crisis and falling demand in the US, the deceleration story is global. The Standard & Poors’ downgrade of US long-term debt from AAA to AA+ will only accentuate this trend. But we will get more cues on the market on Monday, when the markets reopen.
The western countries seem to be running out of ammunition to fight the market selloff. However, an additional stimulus might reverse the selloff - at least temporarily.
The strategy to adopt now is to look for rallies to sell into. Aggressive market players can short the Indian indices and stocks in the futures market. In our 2 July article, we had mentioned that the Sensex could fall as much as 3,700 points if it broke below the symmetrical triangle.
However, we are not sure if the index would fall by 3,700 points as it stayed inside the triangle for the long time. The longer prices stay inside the triangle the lesser the chances of a strong move on the break.
Right now we’d wait for the Sensex to rally to the 17,500 level before shorting. If the index continues to rally, the next level to short is 17,950. Some traders would wait for a confirmation that the market is falling before going short. The level of confirmation is a close below 17,000.
For the Sensex to continue falling it has to clear 15,990, 15,600, 15,200, 14,700 and 13,260. Similar levels on the Nifty are 4,800, 4,677, 4,547, 4,370 and 3,900. These are areas where the Sensex could catch a bounce and levels where traders short on the index can book profits.
If the 13,260 level is broken the Sensex can go all the way down to 10,500. In the case of the Nifty, if the 3,900 level is brokenthe index can fall all the way to 3,150.
Note that both indices have a lot of levels to clear on the way down, which means that the downtrend is expected to be slow.
In previous articles, we had mentioned several factors that were giving negative signals for the equity markets. First was the fall in copper prices. Equities often follow copper prices with a lag. There was also the continued rally in the gold market and a rise in US treasury bond prices, indicating a flight from risk. These were early signals to reduce exposure to the equity markets.
Gold: The precious metal fell slightly following the steep drop in global equity markets. However, it has held on and closed positive for the week. There is a possibility of traders taking profits on gold to reduce losses in equities, but the chart of the precious metal is still bullish.
George Albert is a Chicago-based trend watcher and edits www.capturetrends.com