 "Dollar smashes equity, gold, silver; but don't count on it")
The US Federal Reserve did the “twist” but refused to pour liquidity into the system and the dollar responded by rocketing. The result was a decimation of precious metals and equities, but the path ahead for dollar bulls and equity bears is not going to be smooth.
The Federal Reserve did two things that were positive for the dollar. First, it decided not add any new liquidity to the markets. Then it announced that downside risks to the economy had increased significantly.
A lack of additional dollar supply and risk aversion in the market led to a rally in the dollar. “Operation Twist” by the Federal Reserve is liquidity neutral as it plans to sell short-term bonds and use the cash raised to buy long-term bonds. The goal is to bring down long-term interest rates. The Federal Reserve just had to leave the dollar alone for the greenback to rocket.
[caption id=“attachment_91519” align=“alignleft” width=“380” caption=“The equity market generally moves inversely with the dollar. Getty Images”]
 [/caption]
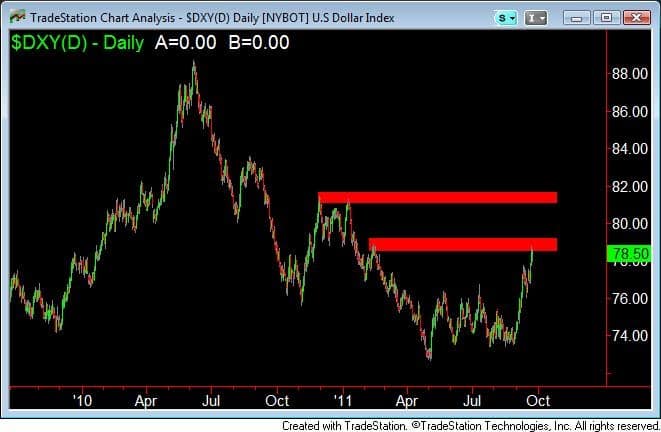
Dollar reaches resistance: The dollar was rallying steadily for the past four weeks and shot into resistance after the announcement of the Federal Reserve. The resistance zone on the dollar index is between 78.5 and 79. This level has to be broken for the greenback to rise further.
Hence right now we’d not be buying the dollar and instead would be booking some profits on long positions. If the resistance level is broken, the dollar index can rise to a level between 80.80-81.50. The resistance areas are marked by red boxes in the chart **.**
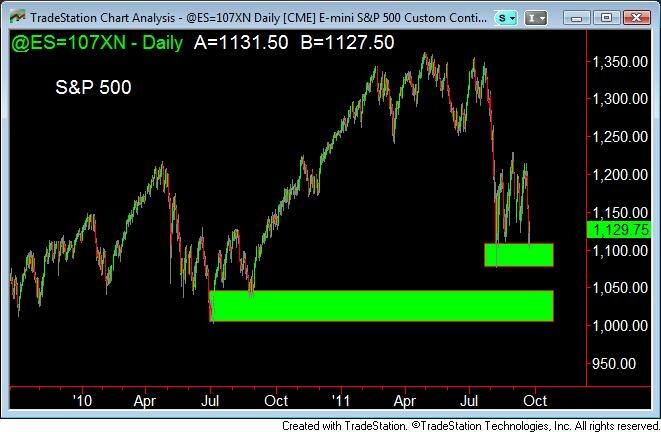
Dollar impact on equities: The equity market generally moves inversely with the dollar. This is true for equities around the globe. As the dollar is at a level of resistance, it’s not advisable to short equities now. In fact, the S&P 500 is near a support zone - marked by green boxes in the S&P 500 chart **.** Prices tend to rise from support levels.
In fact, the S&P bounced a bit on Friday after hitting support.The trend of the equity market is down and it’s highly likely that the support level marked by the upper green box will be broken. But till such time it’s not advisable to short the market.
Once the higher level is broken prices will head to the next level marked by the green box below. If the S&P 500 goes to the level below, one should expect the dollar to rally to the upper red box shown in the dollar chart. Just like the S&P 500, the Bombay Stock Exchange Sensex is also at support.The support level is between 15,750 and 16,100. Keep a close eye on the dollar and the US equity market, as it will give an indication on where the Indian market will go.
If the dollar breaks above its resistance level of 78.5 and 79, the Indian markets will fall. On the other hand, one could see equities and precious metals rally if the dollar sells off from its current resistance level.
Precious metals: Gold and silver move inversely with the dollar and both fell drastically. Ideally, when the risk in the economy increases, both the dollar and gold tend to rally, but not this time.
There is a reason for this. Gold has been rallying for quite some time now and was overbought, hence the selloff should not come as a surprise. Whenever prices move far away from their mean levels, they tend to be pulled back. The current mean level of gold is around $1,500 per troy ounce.
The uptrend on gold is intact and we’d wait for prices to drop to their mean levels to buy. Note that prices are falling rapidly and may overshoot the mean levels. A strategy to adopt could be to wait for prices to fall below the mean level and rise about it before buying.
We are using the 30-week simple moving average as the mean, which is a favourite tool of several long-term investors.
Silver sold drastically last week and is nearing an area of support. The Commodity Channel Index (CCI) is an indicator that shows if an asset is oversold or overbought. The CCI is showing that silver is heavily oversold. The conservative way to trade using the CCI is to wait for prices to come out of the oversold range before buying.
In the CCI, a reading below negative 100 is treated as oversold. Once the index closes above negative 99, it’s considered as leaving the oversold territory. On the weekly chart the CCI is right now at a negative 135.
The markets have been whipping investors and traders around. It’s at times like these one should look at the charts and understand what the price is telling you. Equities are bearish and can go down in the long term, but right now they are near areas from where prices can bounce.

George Albert is Editor www.capturetrends.com
George Albert is a Chicago-based trend watcher and edits www.capturetrends.com