 "Dollar sell-off likely, rally in risky assets back on the table")
The dollar index has reached an area of strong resistance that could lead to a greenback sell off, triggering a rally in risky assets such as commodities and equities.
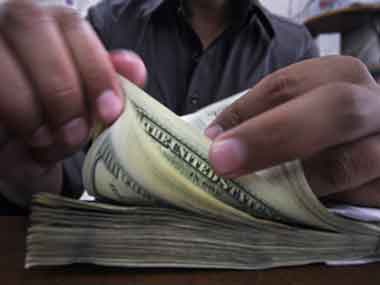
[caption id=“attachment_140922” align=“alignleft” width=“380” caption=“Even as the dollar index reaches an area of resistance, the Indian stock market index, the Sensex, and the US equity index, S&P 500, are near areas of support. AFP”]
 [/caption]
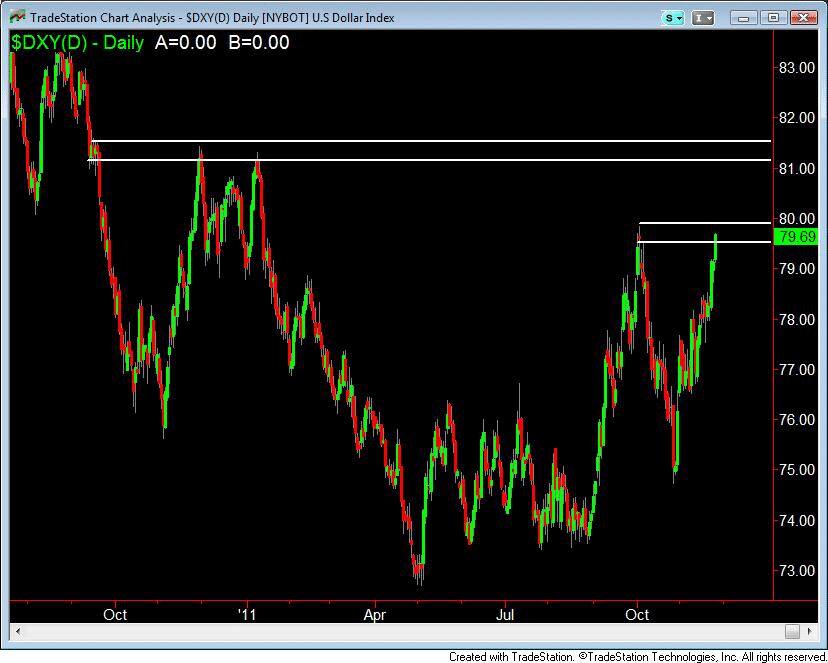
The dollar index, which measures the greenback against six major currencies, has reached a level of resistance between 79.50 and 79.90. See dollar chart here . On Friday, the index closed at 79.69. Even as the dollar index reaches an area of resistance, the Indian stock market index, the Sensex, and the US equity index, S&P 500, are near areas of support. Prices often fall from resistance levels and rally from support levels.
The implication for the rupee
Before we look at the levels of the Sensex and S&P 500, let’s examine the price action in the rupee. Last week, we had mentioned that the rupee had reached an area of support at 51.70 against the dollar. The dollar index too was near a resistance level of between 78.60 and 78.83. We had also mentioned that if the index breaks out of that level, it could rally to the next level of 79.50- 79.90. That’s exactly what happened.
As the dollar rallied beyond the 70.83 level, the rupee depreciated to the 52 level; however, the bears were not able to push it down a lot. The dollar continued to rally all through the week, but the rupee began to rally after 22 November, showing relative strength to the greenback.
Twenty second November was the most recent bottom for the rupee against major currencies such as British pound, euro, Swiss franc, yen and the Australian dollar.
The Indian currency has rallied from its 22 November level strongly in case of some majors and weakly against others. For instance, the rally against the pound was strong but weak against the yen.
In case the dollar begins to fall from its resistance, we can see a strong rupee rally. However, a break higher from the 80 level can take the index to the 81.50 level.
What does it mean for the Sensex?
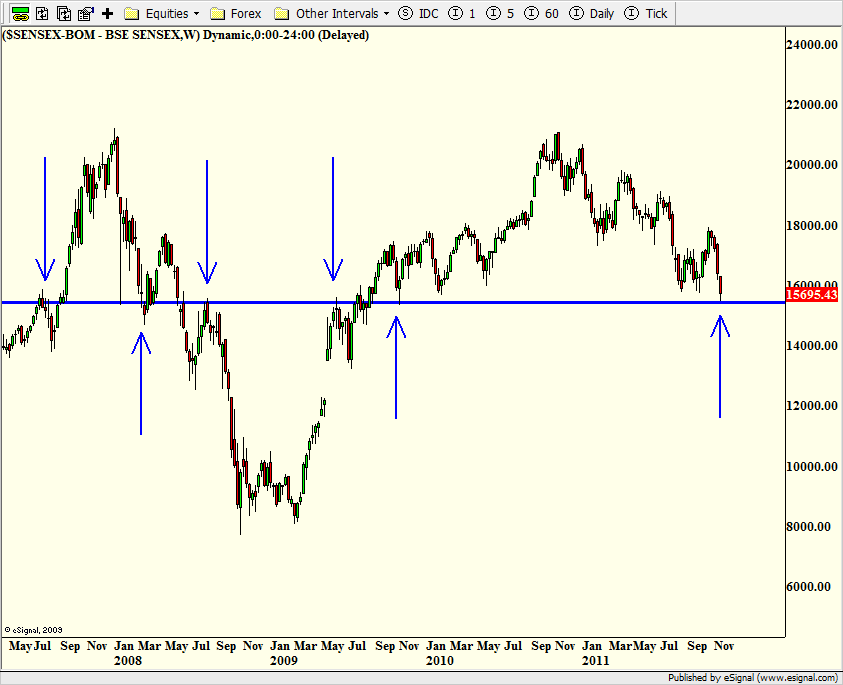
For the Sensex, the 15,500 area is crucial. It has acted both as support and resistance in the past and on Friday, the index reached that level and caught a bounce.
Now, there are three factors that can work in favor of the bulls. First is the 15,500 level. A look at the Sensex chart (Click here ) shows with blue arrows how index has fallen lower from that level and also bounced higher in some instances. Now with the index coming down to that level, there is a possibility that the Sensex will bounce.
The second factor is that the dollar index is at a resistance and can fall. Equities are often inversely related to the dollar and if the greenback falls, the Sensex could rally. And finally, the S&P 500 is at a level of support and could rally as well. Global markets and the Sensex often follows the S&P 500.
What about the S&P 500?
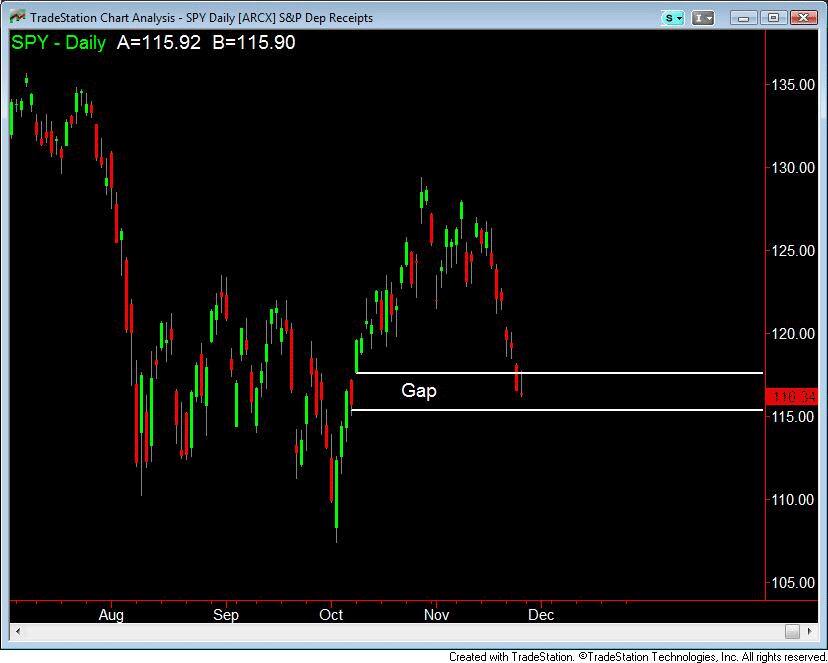
Let us look at the SPY chart Click here . SPY is the exchange traded fund that tracks the S&P 500 index. The chart is a little more complex than the Sensex and dollar index chart as the SPY is entering a gap. A gap happens when a stock or index closes at one level and opens at a different level, either higher or lower.
Prices gap higher when there is extreme demand and low supply, due to which prices have to move much higher to find sellers.
On 7 October , the SPY closed near 115.50 and opened the next trading day at 117.50. On Friday, the SPY closed at 116.34. The gap on SPY is marked by two white horizontal lines. The gap on the SPY is an area of extreme demand, which could lead to a bounce in prices.
The only negative factor of this gap is that it happened in the middle of an uptrend. Gaps at the beginning of a trend are stronger than ones in the middle.
Since major asset classes are at key levels, now is not the time for equity traders to be bearish and dollar traders to be bullish.
However, if the levels are broken, then expect the current trend to continue till dollar reaches the 81.50 level.
George Albert is a Chicago-based trend watcher and edits www.capturetrends.com