 "Dec rallies: Why Santa may take a vacation this year")
The markets are waiting again this year for a Santa Claus rally in December after the huge jump in equity values last week. But history has proven that Santa Claus rallies are not guaranteed and it’s best not to expect one this month.
As we predicted in last week’s article, the equity markets reversed and rallied as the S&P 500 and Sensex were at support levels and the dollar index was at resistance. Prices often rally from support and fall from resistance.
Also, equities generally move inversely to the dollar. Our prediction that the rupee would rally also came true. The bull in the US has reached an area of congestion, which can put the brakes on the rally. But the Sensex and rupee still have some room to rise.
[caption id=“attachment_147165” align=“alignleft” width=“435” caption=“Santa Claus rallies are not guaranteed and it’s best not to expect one this month. Reuters”]
 [/caption]
Many market analysts believe that last week’s rally was just the start of a Santa Claus rally, which could continue well into December. However, it’s not prudent to expect a rally in December based on our research.
We find that Santa is at best an OK trader, nothing great, and does well when the trend is up. During downtrends, prices generally tend to fall or go flat in December. Since December 1994, the markets have rallied strongly five times, stayed flat nine times and fallen three times. That’s not a good batting average.
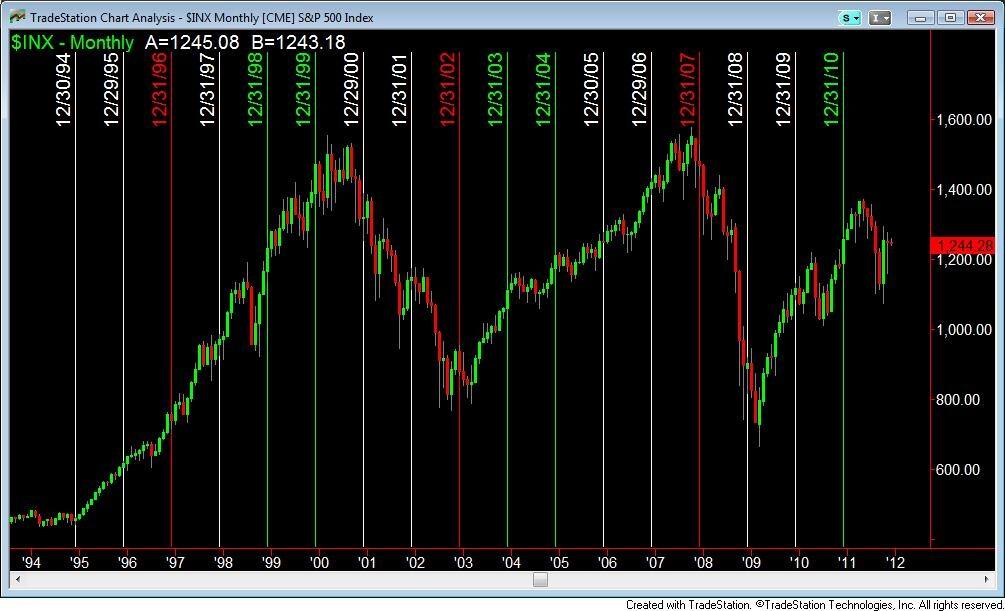
Many times when prices are flat in December, they are not able to cross the previous month’s high. The chart shows all the months of December marked by a vertical line. The white vertical line shows the Decembers when the market was more or less flat, the red line indicates a fall and the green line indicates a rally. We are looking at the S&P 500 as the global equity markets track this index.
Let us look at the December months of each year individually.
1994: The markets fell in November, and rallied in December, but did not move above the November close. However, people investing in December 1994 made money over the long term as that was the beginning of the rally all the way to early 2000. So while we did not see a December rally, 1994 worked out over the long term.
1995: The trend was established in 1994 and continued in 1995, with a small rally in December.
1996: The markets actually fell in December, but then continued the rally up during the next year following the established pattern.
1997 : The markets had a mild increase in December but did not make new highs. The rally continued into the next year.
1998: The market saw a huge rally in 1998, but was still following the trend established in 1994.
1999: The market rallied in December but sold off in January and February of 2000, erasing gains made in December. In fact, the market ended lower in 2000 than December 1999 and the indices peaked that month.
2000 and 2001: By now the bear market had taken hold, and we had a flat December 2000 and the market stayed below the previous month’s high. December 2001 too was flat. But prices continued down during both years following the downtrend.
2002: The market sold off during December and continued down for the first three months of 2003 and then began to rally. This is when the bull marked took hold.
2003 and 2004: Both Decembers are similar, with a slight rally and the markets inching up thereafter following the established bullish trend.
2005 and 2006: The markets were flat in both Decembers but continued to move up.
2007: December saw a fall, which had begun in October. The markets continued to fall all through 2008, making it the worst single year in the recent history of the stock markets.
2008: The markets fell in December and then continued down till March 2009, after which it rallied in 2009.
2009: The markets were flat and then sold off in January 2010. 2010 was volatile but the markets made a new high.
2010: The markets rallied and made a new high in a few months before selling off.
There is a saying in the market: “The trend is your friend till the bend at the end.” This is a good truism for traders expecting Santa Claus rallies. As the Decembers have shown, if the trend is up there is a likelihood of a Santa rally and vice versa.
However, over the past few months, the trend has been flat with the markets very volatile. Hence the odds of a Santa rally are 50:50, which is not very good in the stock market. We’d look for much higher odds to go long now. So for this year we’d not expect a gift from Santa.
George Albert is Editor www.capturetrends.com
George Albert is a Chicago-based trend watcher and edits www.capturetrends.com